Under a resident-needs test, Canada's most permissive AI-datacenter regimes score worst today
Canada's exportable power surplus fell from 51.6 TWh in 2022 to 6.4 TWh in 2025, while datacenter developers asked for more connected power than the provinces have to give: 20,700 MW of datacenter requests in Alberta against a 12,785 MW record peak, datacenter projects inside a 13,605 MW all-sector request list pending on the Quebec minister's desk, roughly 800 MW bidding for BC's 400 MW cap. This note compares all ten provincial grids on spare capacity, generation sources, and export destinations, and scores the seven regimes that made a datacenter decision. The three provinces where a new, large datacenter can still secure power this decade without a hard cap or a rationed queue (Alberta, Saskatchewan, New Brunswick) all perform negative net moral work for their own residents' present needs (Alberta crosses to positive once the domestic compute capacity it builds is counted; Saskatchewan and New Brunswick do not), because the power comes from coal extended to 2050, datacenters exempted from environmental assessment, and projects with unresolved Indigenous rights assertions. The four that ration hardest (Manitoba, Quebec, BC, Ontario) host datacenters too, but behind a hard cap, ministerial selection, or a connection filter left unbuilt, so a developer seeking large unrationed capacity leaves them. Those four carry costs of their own: BC's gas-plant extensions and unpublished 15-applicant register, Quebec's contested Bill 69 rate overhaul, and Ontario's unmade Bill 40 regulations.
Headline finding
Two scores per regime at τ = 1, each against its own residents. W(present) counts the needs a regime serves now; W(future) is the all-in total once the domestic compute capacity it builds is added, with the future contribution kept separate so it never buries a present harm.
On present needs, four regimes perform positive net moral work and three negative. Manitoba (W(present) = +29.0), Quebec (+23.6), British Columbia (+20.2) and Ontario (+14.1) ration or refuse and protect their residents from datacenter-driven scarcity now. Alberta (−8.1), Saskatchewan (−13.6) and New Brunswick (−24.7) clear the path, and the enabling choices carry the negative present filtering: a 932 MW gas plant adding roughly 3 Mt CO2 a year, seven coal units extended to 2050, a 390 MW project registered over a recorded Mi'gmaq rights assertion. The delivered energy those builds generate serves the datacenter tenants, so the symmetric present fulfillment credit reaches residents in the provinces that ration and repatriate, not in the three that build.
Counting the future capacity, the picture splits. Domestic compute capacity built on Canadian soil is credited by megawatt, regardless of operator. Alberta builds the most (1.2 GW executed), and its future contribution (+12.7) outweighs its present harm: W(future) = +4.6, a crossing to positive it earns against a cost still fully counted, though the crossing is thin and reverses at τ = 1.5. Saskatchewan (future +8.1) narrows to −5.5 and New Brunswick (future +1.8, almost nothing built yet) holds at −23.0: neither the coal decision nor the unbuilt-but-emitting posture is laundered by the future credit. All-in: Manitoba +31.0, Quebec +30.9, BC +27.2, Ontario +23.2, Alberta +4.6, Saskatchewan −5.5, New Brunswick −23.0.
The two scores answer two questions: who serves residents' needs now, and who is building the capacity to serve them later. Every flow's Maslow level is set by the mapping table in the appendix; the weight sensitivity set (flat, steep {16,8,4,2,1}, and a threshold-priority test in which present physiological deprivation cannot be offset by any future benefit) is disclosed there. Decisions pending now: BC's 400 MW award list (September 2026), Ontario's Bill 40 regulations, New Brunswick's EIA determination on Lorneville, Quebec's Rate CD hearing (fall 2026), and the AESO's Phase 2 process for the remaining queue. Nova Scotia, PEI, and Newfoundland and Labrador have no datacenter regime to score; their grids appear in the comparison tables.
Where the seven regimes sit
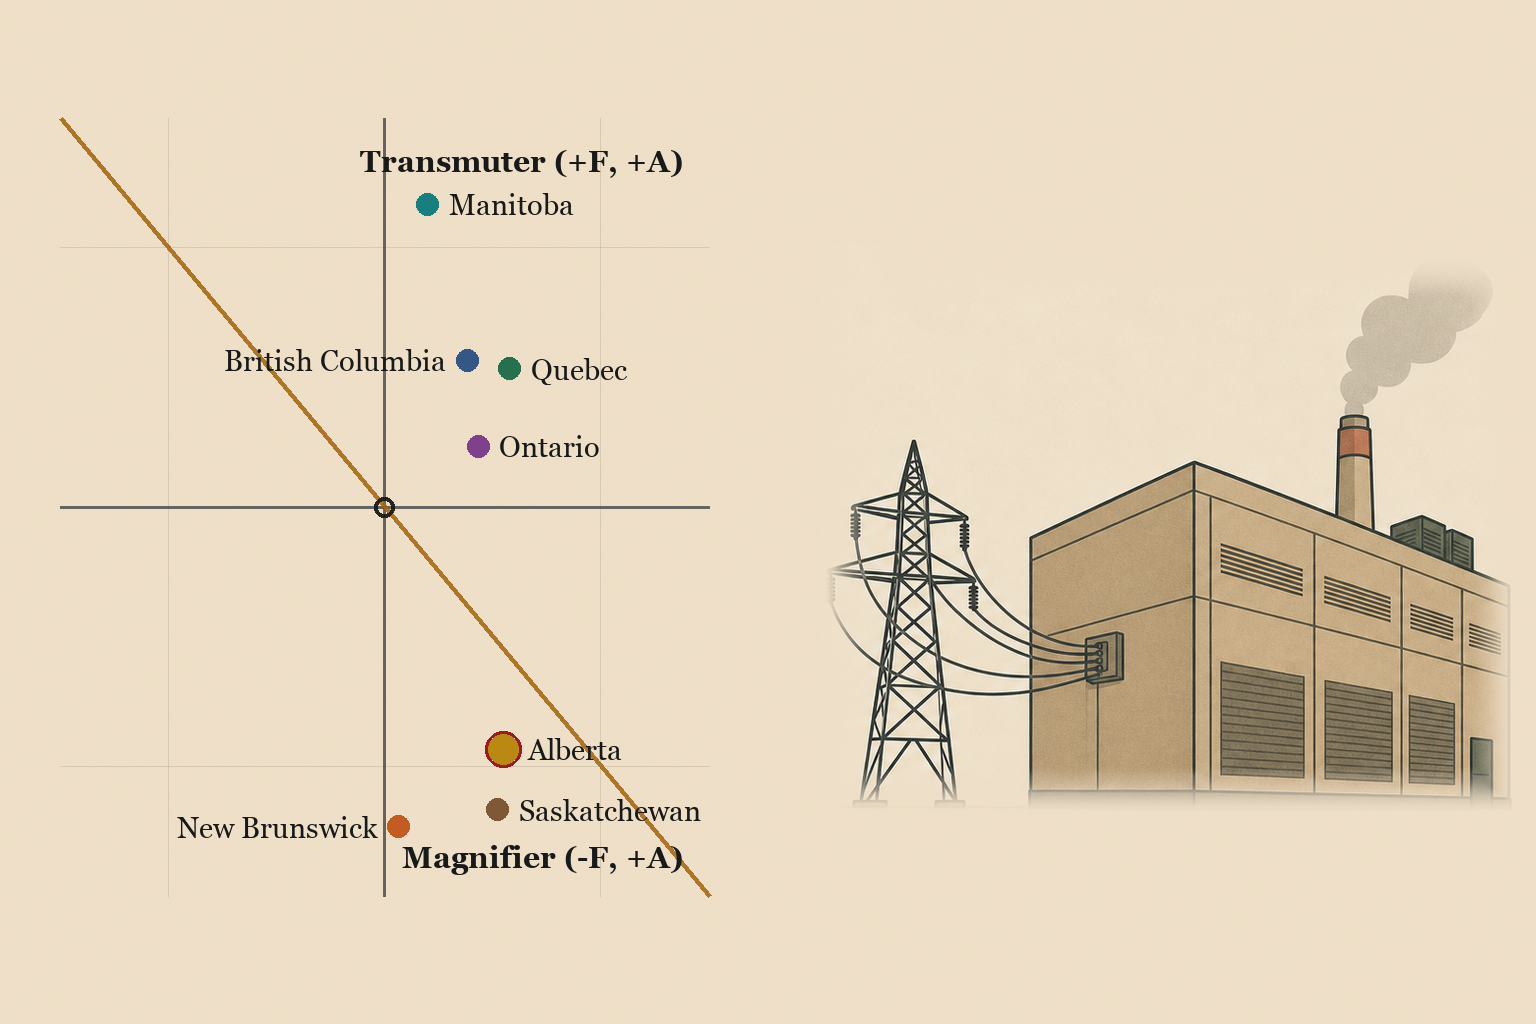
The Transmutarianism map places any agent by what it does to the need that passes through it: whether it filters deprivation (F, vertical) and whether it amplifies fulfillment (A, horizontal). The signs of F and A give four quadrants: Transmuter (+F, +A), Absorber (+F, −A), Magnifier (−F, +A), Extractor (−F, −A).
The chart below plots the seven provincial datacenter-power regimes. All seven sit right of the vertical axis, because every regime emits some fulfillment (jobs, investment, compute access). The vertical split is the finding: four regimes also absorb deprivation on behalf of their residents, and three emit it. Drag the τ slider to test how the reading changes when filtering is weighted above amplification; click any dot for its values and reasoning.
A dot below the diagonal performs negative net moral work even from the Magnifier quadrant: what the regime takes from residents at the heavily weighted physiological and safety levels outweighs the fulfillment it emits above. Alberta, Saskatchewan and New Brunswick all sit there. The per-level scores, stated assumptions, sensitivity math, and the alternative constructions from the pre-publication assumption gate are in How the placements were scored at the end of this note.
The seven scores
| Province | W(present) | W(future) | Present placement |
|---|---|---|---|
| Manitoba | +29.0 | +31.0 | Transmuter |
| Quebec | +23.6 | +30.9 | Transmuter |
| British Columbia | +20.2 | +27.2 | Transmuter |
| Ontario | +14.1 | +23.2 | Transmuter |
| Alberta | −8.1 | +4.6 | Magnifier (crosses positive on future, thinly) |
| Saskatchewan | −13.6 | −5.5 | Magnifier |
| New Brunswick | −24.7 | −23.0 | Magnifier |
W is weighted net moral work at τ = 1 on the unit scale; positive is a Transmuter (filters deprivation and emits fulfillment), negative from the Magnifier quadrant means the resident cost at the heaviest levels outweighs the fulfillment emitted. Reasonable people may weight the levels differently; the purpose is to make the trade-offs visible and contestable, not to fix one ranking.
Why the provinces divide
Three observable differences separate the positive regimes from the negative ones.
- Scarcity discipline. The positive four ration or refuse datacenter load in tight systems (a hard cap, ministerial selection, a connection filter, an outright refusal); the negative three clear the way for a new large entrant with little rationing.
- The enabling generation. Where new firm supply is fossil (Saskatchewan's coal to 2050, Alberta's and New Brunswick's unabated gas), residents absorb the emissions, water, and land harm at the heaviest physiological weight; the rationing provinces avoid or price that harm.
- Who the power serves. When the new generation self-supplies a datacenter tenant, its energy fulfillment leaves the resident denominator while its emissions stay; the provinces that repatriate supply, recover heat, or return trading revenue deliver energy fulfillment to residents instead.
The per-grid inventory, the ten-province comparison, and each regime's per-level scoring are in the expandable sections below; what could move a placement is in What changes the placement.
Public-interest recommendations
Five allocation decisions are open between September 2026 and early 2027; these follow from the placements above.
For Innovation, Science and Economic Development Canada and the Minister of AI
- Condition sovereign-compute support (the $2-billion strategy, the Enabling Large-Scale initiative advancing the Telus BC cluster) on published host-population terms: delivered heat recovery in GWh, curtailability commitments, and annual public disclosure of power, water, and FTE actuals. The federal 850 MW by 2030 target currently names no such conditions.
- Publish the emissions accounting for federally supported compute. The Clean Electricity Regulations sit in abeyance in Alberta under the November 27, 2025 MOU while the largest federally celebrated buildouts run on unabated gas; a sovereign-compute megawatt should carry its carbon disclosure with it.
For Alberta, Saskatchewan, and New Brunswick
- Designate datacenters for environmental assessment. Wonder Valley and Synapse were both exempted in Alberta because a data centre is not a designated activity (Environmental Law Centre, June 24, 2026); the Lorneville registration is the only one of the three provinces' flagship projects inside a formal EIA.
- Publish the deal terms. Saskatchewan's industrial rate for the Bell campus and the Crown infrastructure costs are undisclosed (Policy Options, April 29, 2026); allocation of scarce firm power by unpublished bilateral negotiation prices a public asset in private.
- Complete consent processes before permits issue: the Sturgeon Lake Cree Nation judicial review of the Wonder Valley water licence and the Mi'gmaq Rights Impact Assessment recorded in the Lorneville registration are both open while approvals advance.
For British Columbia, Quebec, and Manitoba
- Publish the queue. BC has not released the register of its 15 applicants; Quebec's pending-request list exists only in National Assembly transcripts; Manitoba's 13 connection requests surface only in a rate-application information response. A rationing regime is auditable only if the ration book is public.
- State the triggers that would change the ration: which supply milestones (Revelstoke 6, the 2024/2025 call wind, Hydro-Québec's Action Plan additions, Manitoba's 2029/30 build) release how many megawatts to which class of load.
For Ontario
- Make the Bill 40 regulations. The connection-approval filter received royal assent December 11, 2025 and binds no one while "specified load facility" remains undefined (status as of July 2026); the IESO has received single-point requests up to 750 MW while the regulations stay unmade.
For utilities and proponents
- Offer curtailability as the default. Independent modelling finds US grids could absorb 76 GW of new load that curtails 0.25% of hours a year (Duke Nicholas Institute, February 2025); BC's call requires 24-hour curtailability and NB Power has asked for the same flexibility.
- Adopt the annual disclosure stream in the audit protocol below: capex, GWh consumed, GWh of heat recovered, water withdrawals, and FTE counts, per site, per year.
What this evaluation is
The Foundation publishes a measurement framework called Transmutarianism. The framework scores any agent (a person, an organization, an institution) on what it does to the flows of need passing through it: deprivation absorbed, deprivation emitted, fulfillment emitted, fulfillment absorbed. The output is a position on a four-quadrant map and a single weighted number, W, that captures the net relational work the agent does.
This note applies the framework to provincial datacenter-power regimes: each provincial government and its grid operator acting together on datacenter connection, allocation, rate, and enabling-generation policy, as constituted in July 2026. It is a companion to Field Note 09, which scored four provinces' AI policy posture (strategy, deployment rules, privacy, an automated-decision right); this note scores the physical side, who gets the megawatts and what the getting costs, and its placements measure a different object. The math is at /framework/; the live quadrant explorer is at /quadrant/. Every empirical claim links to its source; figures carried by a single source are flagged as such. The placements are provisional; better data moves the dots. Reasonable people can weight these trade-offs differently: the purpose of the scoring is to make the trade-offs visible and measurable on stated assumptions, and every assumption is on the page.
Energy: spare megawatts, spare terawatt-hours, and who has either
"Spare capacity" means two different things, and provinces hold them in different combinations. Megawatts at winter peak decide whether a grid can serve a new always-on load; terawatt-hours across the year decide whether serving it forces imports or new generation. The Canada Energy Regulator's trade workbook shows the national energy cushion collapsing from 51.6 TWh of net exports in 2022 to 6.4 TWh in 2025, on drought and domestic demand growth.
BC is short on both axes in its own filings. BC Hydro's 2025 IRP filings (BCUC Exhibits B-8 and B-9, May and June 2026) model capacity cushions of +98 MW in F2028 and +54 MW in F2029 before planned resources, deficits of 19 to 213 MW a year through the mid-2030s, and an F2030 energy surplus of just +284 GWh even after every planned resource arrives on schedule. The utility imported a net 8,356 GWh in fiscal 2025 (its audited service-plan report), the third consecutive import year, and is negotiating to keep two gas plants (Island Generation, 275 MW; McMahon, 120 MW) that CleanBC had scheduled out. Press coverage rendered this as a "500 MW shortfall by 2030"; the filing's own language is a 500 MW load-forecast increase, and the modeled deficits are smaller. Site C's full 1,100 MW arrived in August 2025 and the 2024 and 2025 calls procured 2,555 MW of wind, nearly all with 51% First Nations equity, online by 2033; between now and then, the 400 MW datacenter cap is the policy expression of a grid with two-digit megawatt cushions.
Alberta is energy-long and peak-capacity-constrained. The AESO's 2025 statistics show a ~3.0 TWh net export surplus and a 24.1% reserve margin, down from 32.6% in 2024. Against that, the datacenter queue reached 20.7 GW of cumulative requests by Q3 2025 (the AESO's own chart) and stood at 19,565 MW across 41 projects in the July 2026 Connection Project List, roughly 1.5 times the record peak. The AESO's binding answer is 1,200 MW connectable through 2028 without new transmission, allocated in full to two projects by October 2025; everything else waits on a bring-your-own-generation process. New firm load in Alberta this decade means new gas: Greenlight's 932 MW for Meta, Keephills, and the off-grid projects.
Saskatchewan's headroom is a coal decision. SaskPower's 2025-26 annual report shows 6,191 MW of available capacity against a 3,910 MW record peak, with roughly 930 MW of that non-firm wind and solar, exports of 1,124 GWh and imports of about 7% of supply: a system near balance that buys firmness from Manitoba. The 300 MW Bell load fits because cabinet directed all seven coal units extended toward 2050; the Minister of Crown Investments said without dispatchable baseload including coal "this data centre announcement would have never happened" (Pipeline Online, March 16, 2026, a single-outlet quote; the diversion-excluded construction that drops the coal-datacenter tie flips Saskatchewan's W to +6.4, so the sign does not rest on it alone). The rate application filed January 2, 2026 forecasts provincial demand to 2026-27 and predates the Bell announcement, so no public forecast yet includes the province's largest new load.
Manitoba has energy in average water years and no firm room at peak. Manitoba Hydro's 2025 IRP sets a system capacity need date of 2029/30; its 2023 briefing note told the government a single energy-intensive connection "may consume all remaining electrical capacity" with 57 large-load proposals pending. Drought produced net losses in two of the last three fiscal years, and the January 2025 record peak of 5,111.5 MW was met while exporting 330 MW under contract and importing 60 MW. The regime's response is recorded in statute and in a decision: rate classes with a default +100% levy for datacenters and crypto (SM 2026 c.32), and the Premier's June 4, 2026 rejection of a proposed farmland hyperscale datacenter that could scale into the hundreds of megawatts: "There's a big threat to the environment and not much benefit to the economy." (A separately reported 250-300 MW provincial concept, explored with Rothschild advisers in late 2025, ended the same way.)
Ontario is the only province with a present energy surplus, and it is a timing window. The IESO exported a net 18.0 TWh in 2025 (8.8 TWh to Quebec, 7.5 to New York, 4.4 to Michigan), which averages roughly 2.1 GW across the year, about two hyperscale campuses running flat. Its 2026 Annual Planning Outlook shows incremental energy needs of 8.5 TWh by 2032 and capacity deficits beginning under 100 MW in 2034, rising to 3,800 MW by 2040; datacenter demand in the forecast grows from 4.5 TWh in 2027 to 22.6 TWh in 2050, and the 2025 outlook before it admitted roughly 1.8 GW of the ~6.7 GW then proposed. Darlington's four refurbished units returned in February 2026; the first SMR is targeted for 2030.
Quebec's surplus is over, on Hydro-Québec's own numbers. The utility bought more short-term energy than it exported in 2025 (15.2 TWh against 11.8 TWh, its SEC Form 18-K); exports fell from 36.2 TWh in 2021 to 11.8 TWh in 2025 while two new firm export lines (NECEC, 1,200 MW to Massachusetts; CHPE, 1,250 MW to New York City) entered service in 2026, CHPE under a 25-year NYSERDA contract. Its supply plan shows residual energy needs of 16.4 TWh by 2029 and unfilled capacity of 2,050 MW by 2031-32 after planned additions. Datacenter access is the most explicitly rationed in Canada: 956 MW granted of 2,671 MW of compliant requests in the first allocation (one datacenter among eleven winners), a pending all-sector request list the minister put at 13,605 MW in April 2024, and a supply-plan datacenter allowance of 1,102 MW at winter peak by 2035.
Exports are a destination with an off-ramp. Ontario applied a 25% surcharge on exports to Michigan, New York and Minnesota on March 10, 2025 and suspended it the next day; the IESO's tariff page still carries the mechanism at $0. Manitoba declined to renew 500 MW of Xcel contracts at end-March 2025 and earmarked the power domestically. Roughly 90% of Churchill Falls' output, the bulk of NL's 34.5 TWh of net outflows, runs to Hydro-Québec at 0.2¢/kWh under a contract that binds until 2041; the December 2024 MOU that would reprice it failed its independent review in May 2026 and its Innu ratification vote in October 2025, so Labrador's stranded energy has no consented path to any datacenter this decade.
Sovereignty: whose compute the megawatts buy
Three US firms hold about 85% of Canada's cloud-infrastructure spending (RBC, June 2026), and the federal Sovereign AI Compute Strategy answers with $2 billion, of which one commercial agreement had been finalized by mid-2026 (up to $240M to Cohere, computing at a CoreWeave-operated Ontario site) and a national target of 850 MW of domestic AI compute by 2030 stands against a federal projection of 5.5 GW of commercial demand.
The provincial buildouts sort by whose compute the megawatts serve. Alberta's largest executed allocation serves Meta; no sovereignty condition attaches to it. Saskatchewan's campus is Bell-built with US anchor tenants (CoreWeave, Cerebras), and the "sovereign AI" label on it has no legal definition (Policy Options). BC's grandfathered cluster is the explicit federal sovereign play: Telus and Ottawa advancing 85 MW toward 150 MW and 60,000 GPUs under the Enabling Large-Scale initiative, on 98% clean power, with federal money not yet committed. Quebec attaches sovereignty conditions to selection itself ("plus de crypto, tout de l'IA") and its premier recast datacenters as a digital-sovereignty opportunity in November 2025. Ontario's data-residency pull already routes federal and financial workloads to the GTA. Manitoba's Balsillie-led task force recommended sovereign data infrastructure; the province kept small AI datacenters welcome while refusing hyperscale.
No datacenter or datacenter-dedicated energy project sits on the Building Canada Act's national-interest track as of July 21, 2026; the Major Projects Office lists include transmission (North Coast) and nuclear (Darlington SMR) that serve load growth generally. The Canada Infrastructure Bank's February 2026 priorities name AI datacenters a target sector with no closed deal yet.
Labour: what a megawatt buys in jobs
Hyperscale operations staffing runs 0.2 to 0.4 permanent FTE per MW across industry benchmarks, with most economic benefit in the 18-to-36-month construction phase (Virginia JLARC, December 2024). The Canadian claims sit inside the band: Saskatchewan's 300 MW campus claims 80+ permanent jobs (0.27/MW) against 800+ construction; Meta's ~1 GW site claims 300 operational (0.3/MW) against 3,000+ construction; Lorneville claims 210 permanent on 390 MW (0.54/MW, above the benchmark range and unverified). At those ratios the capital cost per permanent job is measured in tens of millions of dollars: $21M per job on Bell's $1.7B initial capex, before the tenant hardware that carries most of the claimed $12B value and leaves with the tenants.
The strongest causal evidence for datacenter employment effects is county-level and modest: US counties gaining datacenters saw private employment rise 4 to 5% over five to six years, three times less than naive comparisons suggest, with gains concentrated in construction (+11%) and information (+22%) (Brookings, May 2026). Alberta's compute-hardware levy (2% grid-connected, 1% self-generating, 0% off-grid, from December 31, 2026) is the only Canadian instrument that converts datacenter capital into recurring provincial revenue; Loudoun County's $200k per MW-year of equipment tax does not transfer to provinces that levy no personal property tax on computer equipment.
The investment figures on the record, all proponent figures: Meta $13B+ in Alberta; Bell $1.7B initial in Saskatchewan, inside a claimed $12B of long-term value that includes roughly $10B of tenant-owned hardware; Beacon/VoltaGrid $2B in New Brunswick; Microsoft's $19B Canada commitment ($7.5B over 2026-27) landing first Ontario capacity; Telus's claimed $9B of BC economic value. Recurring public revenue has one instrument on the record, Alberta's compute-hardware levy. The innovation channel runs through compute access: the federal AI Compute Access Fund's first $66M reached 44 small and mid-sized firms in May 2026, Bell's Thompson Rivers University facility carries student and faculty access, QScale hosts Canadian AI and HPC workloads at Lévis, and the one finalized federal sovereign-compute agreement puts Cohere's workloads in a CoreWeave-operated Ontario building. The causal jobs evidence above is US-based; no Canadian study of realized datacenter economic impact exists as of July 2026.
Urban: water, land, and the rooms where consent was asked
Wonder Valley's preliminary Water Act certificate authorizes 24 million m³ of water a year, in a region that National Observer's analysis places among the three-quarters of planned Alberta datacenters sited in high or extremely high water-stress areas, with no provincial environmental assessment required (the Environmental Law Centre's finding). Best-in-class hyperscale water intensity is 0.19 to 0.27 L/kWh (AWS and Microsoft fleet figures) against an industry average near 1.8 L/kWh; none of the Canadian projects has published a water-use effectiveness commitment. The Lorneville registration carries a 755 kt CO2e/yr emissions figure, and The Narwhal reports 27 ha of wetland infill and 3.5 ha of old-growth clearing from the project's filings, for the 390 MW campus and its 190 MW gas plant.
The municipal record runs in both directions. Vancouver council defeated a pause on large AI datacenters 7-3 on July 15, 2026. Mississauga's first hyperscale application was referred back to staff with councillors backing a one-year moratorium and a resident petition against it. The RM of Sherwood approved Bell's development agreement within five weeks of the announcement. Saint John approved the industrial-park expansion that hosts Lorneville, and three residents took the rezoning to judicial review. Sturgeon County broke ground on Meta with a premier in attendance. Municipal consent is being granted quickly where provinces court projects and contested where residents meet them first.
Ethical implications: who carries the risk when the bet is wrong
The consent record splits the same way the quadrant does. In the negative-W provinces: Sturgeon Lake Cree Nation is in judicial review over the Wonder Valley water licence and says it was not consulted; Mi'gmawe'l Tplu'taqnn Inc. is recorded in the Lorneville EIA registration stating the project "may infringe upon lands that are considered by them to be unceded Indigenous territory" and that it "will not support any loss of its unceded territory," with the rights assessment unfinished while the determination advances; Saskatchewan's only Indigenous component is a workforce MOU with George Gordon First Nation, which the Nation itself welcomes, with no equity. In the positive-W provinces: Upper Nicola Band members voted 98-33 to approve the Bell site on their land with the Band as sublandlord; BC's enabling wind carries 51% First Nations equity across both calls; Manitoba's wind procurement requires Indigenous majority ownership. Alberta also holds the one Indigenous-led project in the set, Woodland Cree First Nation's 650 MW Mihta Askiy. Where consent was structured as ownership, it was granted; where it was structured as notification, it is in court. Consent is also failing on the supply side that would feed future datacenters: the Labrador Innu ratification vote failed in October 2025 and Pessamit voted 63% against a $2.5B Hydro-Québec agreement in July 2026.
The rate-risk evidence runs both directions. In PJM, the independent market monitor attributes $21.3 billion, 45% of the last three capacity auctions' cost, to forecast datacenter load, $6.2 billion of it tied to datacenters not yet built (Monitoring Analytics, January 2026); Virginia's legislative auditor projects $14-37 a month on a typical residential bill by 2040 from datacenter-driven buildout. Against that, an instrumental-variables study finds US datacenters built 2019-2024 left average state residential rates about 6% lower than they would otherwise have been, by spreading fixed costs (Watten, Bistline and Blanford, June 2026), and an industry-funded E3 review found no historical cross-subsidy in eleven quantitative studies while flagging a Georgia Tech counter-result inside its own pages. No Canadian econometric equivalent exists as of July 2026. Alberta is running the live experiment: the AESO told stakeholders the proposed 1.6 GW of bridging datacenter load "is anticipated to increase pool prices while reducing transmission costs," and the province claims a reduction of up to 6% in transmission costs from Meta's load alone.
The depreciation debate decides who holds the residual. Hyperscalers book AI servers over five to six years; Michael Burry's public short case argues two to three; moving a 1 GW campus from a five-year to a three-year IT life raises its annualized cost from $8.5B to $12B (Epoch AI, May 2026). A province that extends coal to 2050 or permits a 932 MW gas plant against tenant demand carries a 25-year asset against a customer whose own hardware cycle is measured in GPU generations. Saskatchewan's exposure is the sharpest: a $2.6-billion refurbishment, triple its initial estimate, partly justified by a single deal whose terms are undisclosed.
What changes the placement
Toward Transmuter, for the negative-W regimes: Alberta designates datacenters for environmental assessment and conditions the next allocation phase on verified emissions abatement; Saskatchewan publishes the Bell deal's rate and infrastructure costs and pairs the load with the clean-supply path its own academics propose; New Brunswick completes the Mi'gmaq Rights Impact Assessment before an EIA determination and makes the flexible-load requirement binding. Each of these moves booked negative filtering toward zero without touching the fulfillment already scored.
Toward Extractor, for anyone: BC awarding capacity outside its own caps without publishing the register; Quebec allocating under Bill 69's ministerial discretion without the Régie's independent review surviving the fall 2026 rate hearing; Manitoba holding the double levy while re-signing equivalent firm exports abroad rather than releasing supply to any domestic use; Ontario leaving "specified load facility" undefined while 750 MW single-point requests connect under ordinary rules; any province converting rationed public capacity into unpublished bilateral deals.
Better data moves the dots: the September 2026 BC award list, the Lorneville determination, the Rate CD decision, the Bill 40 regulations, and the first audited disclosure from any operating campus would each re-score a placement directly.
Governing parties and the placement
The seven regimes are run by governments of four parties. Mapping each placement onto the party that produced it tests whether the split is a political artifact or an artifact of the energy record. Each posture below is sourced in the sections above; the party and premier are the government of record in July 2026.
| Province | Governing party (premier) | Datacenter-power posture | W(present) / W(future) |
|---|---|---|---|
| BC | New Democratic (Eby) | Enacted 400 MW competitive cap with 24-hour curtailability and a permanent crypto ban (B.C. Reg. 8/2026); the sovereign cluster is grandfathered outside it | +20.2 / +27.2 |
| Quebec | Coalition Avenir Québec (Legault) | Ministerial authorization at 5 MW, 956 MW granted of 2,671 MW requested, a proposed Rate CD near 13¢/kWh, zero new crypto megawatts | +23.6 / +30.9 |
| Manitoba | New Democratic (Kinew) | Hyperscale rejected June 2026; a default +100% levy on datacenter and crypto rate classes (SM 2026 c.32) | +29.0 / +31.0 |
| Ontario | Progressive Conservative (Ford) | Bill 40 connection-approval filter (royal assent December 2025, regulations unmade); a present 18.0 TWh export surplus | +14.1 / +23.2 |
| Alberta | United Conservative (Smith) | Open-door strategy; the 1,200 MW interim limit fully allocated; new firm supply is unabated gas | −8.1 / +4.6 |
| Saskatchewan | Saskatchewan Party (Moe) | Bilateral Crown deal for the Bell campus; seven coal units extended toward 2050 | −13.6 / −5.5 |
| New Brunswick | Liberal (Holt) | Courting hyperscale (Lorneville 390 MW) with 190 MW of on-site gas; the EIA determination is open | −24.7 / −23.0 |
Each party's policy posture
British Columbia, New Democratic (Eby). BC Hydro run as a public clean-energy monopoly under the CleanBC framework; scarce firm power rationed through a competitive Call for Demand scored on price and community benefit; the Telus sovereign-compute cluster grandfathered outside the 400 MW cap.
Quebec, Coalition Avenir Québec (Legault). Hydro-Québec allocation recast as digital sovereignty ("plus de crypto, tout de l'IA"); Bill 69 concentrating allocation and rate-setting in ministerial hands; datacenter access selected on benefits per rationed megawatt and priced at a proposed Rate CD near 13¢/kWh.
Manitoba, New Democratic (Kinew). Manitoba Hydro framed as power sovereignty; 500 MW of expiring US export contracts repatriated for domestic use; datacenter and crypto load priced out through Bill 39's default +100% levy; a hyperscale build the system could not firmly serve refused.
Ontario, Progressive Conservative (Ford). Supply-side build-out (Darlington refurbishment, the first SMR targeted for 2030) paired with an affordability-and-benefit connection filter under Bill 40, "Protect Ontario by Securing Affordable Energy"; the filter enacted and non-binding while its regulations stay unmade.
Alberta, United Conservative (Smith). Canada's only deregulated energy-only market; an open-door AI Data Centres Strategy; renewables restrictions that channel new firm supply to gas; the federal Clean Electricity Regulations in abeyance under a November 2025 provincial-autonomy MOU.
Saskatchewan, Saskatchewan Party (Moe). SaskPower's coal fleet extended toward 2050 against the federal phase-out, on a stated dispatchable-baseload rationale; scarce Crown power allocated to the Bell campus by bilateral deal with undisclosed terms.
New Brunswick, Liberal (Holt). NB Power courting hyperscale to a province that has lost industrial anchors; the Lorneville build enabled by 190 MW of on-site gas; a legislated datacenter moratorium refused while the environmental assessment stays open.
The four positive placements are held by New Democratic governments (British Columbia, Manitoba), a Coalition Avenir Québec government (Quebec), and a Progressive Conservative one (Ontario). The three negative placements are held by United Conservative (Alberta), Saskatchewan Party (Saskatchewan), and Liberal (New Brunswick) governments. The lowest score of the seven is a Liberal government's and the highest is a New Democratic one's, with a Progressive Conservative government scoring positive between them. The sign of W does not sort by left and right.
It does not sort by electricity-market structure either. The two restructured wholesale markets, Alberta and Ontario, land on opposite sides of the diagonal, and the five Crown-utility provinces split three positive (British Columbia, Manitoba, Quebec) and two negative (Saskatchewan, New Brunswick). The quantity that moves with the sign is the one the note scores: whether the regime rations or clears scarce firm power, and whether the generation enabling the load is clean or fossil.
A note on framing
The Foundation publishes these placements to give the parties at the table a shared instrument: one map on which a premier's groundbreaking, a utility's load-resource balance, a Nation's ratification vote, and a ratepayer's bill are entries in the same ledger. The comparison is deliberately harsher than a market ranking and more transparent than one: every number above can be replaced by a better-sourced number, and the dot moves.
The classification describes flows, and the people inside these institutions are working within incentive structures the framework exists to make visible. A grid planner extending a gas contract against a two-digit megawatt cushion and a minister signing a coal directive to land a campus are answering the same question with different ledgers open. The recommendations are addressed to the institutions that keep the ledgers.
The Foundation is based in British Columbia, one of the seven scored regimes; the exposure is disclosed, as it was in Field Note 09. The president holds a disclosed position in PolarGrid, a compute-market company; the scored subjects here are governments and utilities, and no compute vendor is scored.
Technical appendix
The evidence base and the full scoring machinery, expanded. The ten-grid comparison and the project inventory are here; how each placement was scored follows below.
Ten grids at a glance
Installed capacity and generation mix are megawatts and shares of energy; trade positions are terawatt-hours of energy. The two do not substitute for each other, and the distinction decides several placements below. Sources for each row are linked in the domain sections; the full source register (269 entries) is in the research brief in the repository.
| Province | Installed capacity | Record peak | Generation mix (latest) | 2025 trade position | Main destinations / sources | Datacenter regime |
|---|---|---|---|---|---|---|
| BC | ~18,500 MW province-wide; BC Hydro 13,447 MW | 11,363 MW (Jan 2024) | 91% hydro | Net importer 3 straight years; F2025 net imports 8,356 GWh | Exports via Powerex to WA, CA, OR, AB; drought imports from the US Northwest | 400 MW capped competitive call to 2028; crypto banned |
| AB | 23,242 MW | 12,785 MW (Dec 2025) | Gas 76.8% of 2025 energy; coal 0% since 2024 | Net exports ~3.0 TWh (exports 6× imports) | Mostly BC; Montana; minimal SK | Open door; 1,200 MW interim limit fully allocated; 19,565 MW queue (Jul 2026) |
| SK | 6,191 MW | 3,910 MW (Dec 2021) | Capacity: gas 41%, coal 25%, hydro 18%, wind 13% | Exports 1,124 GWh; imports ~7% of supply | Exports to MISO/SPP; firm imports up to 315 MW from Manitoba | Bilateral Crown deals; Bell 300 MW; no published queue |
| MB | 6,074 MW (Manitoba Hydro) | 5,111.5 MW (Jan 2025) | >96% hydro | Exports ~7.97 TWh FY2024-25 ($860M, 80% US) | MISO (MN, WI, ND), SK, ON; contracts to 2052 | Hyperscale rejected Jun 2026; +100% default levy rate class |
| ON | 37,760–39,032 MW grid-connected | 27,005 MW (Aug 2006); 24,862 MW in 2025 | Nuclear ~48%, hydro ~23%, gas ~19% of 2025 energy | Net exports 18.0 TWh | Quebec 8.8 TWh, New York 7.5, Michigan 4.4 | Bill 40 ministerial approval; regulations pending |
| QC | Hydro-Québec 37,369 MW + Churchill Falls access | 43,124 MW (Feb 2023) | ~94% hydro | Net short-term importer: bought 15.2 TWh, exported 11.8 TWh | NY (CHPE 1,250 MW), New England (NECEC 1,200 MW), VT; buys from US markets and Churchill Falls | Ministerial authorization at 5 MW+; ~1,102 MW rationed to 2035; Rate CD ~13¢ proposed |
| NB | 4,723 MW province-wide; NB Power 3,772 MW | 3,326 MW (Jan 2004) | Nuclear ~40%, fossil ~27%, hydro ~23% of energy | Net outflows 3.0 TWh (2023) | Maine/ISO-NE, PEI; opportunistic imports from QC and Maine | Courting hyperscale (Lorneville 390 MW); crypto banned |
| NS | 2,839 MW | 2,481 MW (Jan 2026; load shedding narrowly avoided) | Coal 47.3% (2023) | Net importer 2.8 TWh (2023) | NB tie, Maritime Link (Muskrat Falls block) | None; deferred until Wind West operates |
| PEI | 441 MW, nearly all non-firm wind | 404 MW (Jan 2026) | ~99% wind on-island | ~69% of consumption imported | NB submarine cables (560 MW) | None; 112 MW firm-capacity gap |
| NL | 8,682 MW (Churchill Falls 5,428 MW) | Island ~1,770 MW (Feb 2023) | ~97% hydro | 34.5 TWh net outflows (2023) | ~90% of Churchill Falls to Hydro-Québec at 0.2¢/kWh to 2041 | None; crypto moratorium since 2022 |
The proposed and executed projects
| Project | Province | Scale | Power source | Status, July 2026 |
|---|---|---|---|---|
| Meta / Greenlight (Sturgeon County) | AB | ~1 GW; $13B+ | 970 MW grid allocation; 932 MW new gas CCGT (permitted to 1,864 MW) | Under construction; ground broken July 8, 2026 |
| TransAlta Keephills | AB | 230 MW (to 1 GW) | Gas site, legacy coal-era transmission | Executed AESO contract Oct 2025; CPP Investments/Brookfield MOU |
| Beacon AI Centers (six sites) | AB | ~4.5 GW claimed | Grid first, then self-generation | In queue; no executed contract |
| Wonder Valley (Greenview) | AB | 7.5 GW / $70B+ claimed | Off-grid gas + geothermal claimed | Pre-construction; land unfinalized, no anchor tenant, no EIA required; 24M m³/yr water certificate under judicial review |
| Mihta Askiy (Woodland Cree FN-led) | AB | 650 MW | Off-grid gas | No federal assessment required (Mar 2026); 300 MW also in AESO queue |
| eStruxture CAL-3 | AB | 90 MW / ~$750M | Grid | Under construction, commissioning 2026 |
| Bell AI Fabric campus (RM of Sherwood) | SK | 300 MW / $1.7B | SaskPower (coal/gas-heavy) + 300 MW on-site gas backup | Under construction; first hall H1 2027 |
| Telus Sovereign AI Factories (Kamloops, 2 Vancouver sites) | BC | 85 MW now, 150+ MW by 2032 | BC Hydro (98% clean); pre-existing agreements outside the competitive call | Kamloops online 2026; Vancouver sites 2026-2029 |
| Bell AI Fabric BC (Kamloops, Merritt + 2 large sites) | BC | ~500 MW program incl. 400+ MW two-site block | BC Hydro; large-site path unresolved under the 400 MW cap | 7 MW operating; 26 MW by end-2026; large sites unresolved |
| 2026 Call for Demand pool | BC | 15 applications, ~800 MW sought | BC Hydro, 400 MW cap | Awards September 2026; register unpublished |
| Beacon / VoltaGrid Lorneville (Saint John) | NB | 390 MW / $2B | 190 MW on-site gas + 200 MW grid draw | EIA determination in progress; judicial review of rezoning; construction targeted 2026 |
| Microsoft GTA expansion | ON | Undisclosed MW; $7.5B over 2026-27 | IESO grid | Under construction; capacity from H2 2026 |
| Prologis Meadowvale (Mississauga) | ON | >100 MW | IESO grid | Application referred back; resident petition; construction late 2028 at earliest |
| QScale Q01 (Lévis) | QC | 142 MW contracted | Hydro-Québec | Operating and expanding; shortlisting Ontario for growth |
| KEEL (ex-Bitfarms) Sherbrooke | QC | 96 MW | Hydro-Québec (crypto-to-AI conversion) | Conditional municipal approval July 13, 2026 |
| Google Beauharnois | QC | $735M announced | Awaiting Hydro-Québec allocation | Lobbying for 100-250 MW |
| Jet.AI / Consensus Core (Île-des-Chênes) | MB | Multi-hundred MW claimed | Grid + on-site gas proposed | No connection request or municipal application; Premier said no (June 2026) |
Datacenter load as a share of each grid
Shares are computed against the system-operator capacity basis stated in each row. Executed or operating load and requested or proposed load are different classes and are never summed; off-grid proposals (Wonder Valley, Mihta Askiy) sit outside the grid basis and are noted rather than counted. Megawatt figures are sourced in the sections above and below; the percentages are derived from them.
| Province (capacity basis) | Basis MW | Executed or operating datacenter load | Requested or proposed | Investment and jobs on the record |
|---|---|---|---|---|
| BC (BC Hydro) | 13,447 | ~178 MW (1.3%): ~60 MW legacy allocations, Telus's 85 MW secured, Bell's 33 MW operating or building | ~1,200 MW (8.9%): ~800 MW of Call for Demand bids against the 400 MW cap (3.0%), plus Bell's unresolved 400+ MW two-site block | Telus claims $9B of BC economic value; Bell's $2B+ national AI Fabric program |
| Alberta (AESO) | 23,242 | 1,200 MW executed (5.2%): Meta/GLDC 970, Keephills 230 | 19,565 MW queued (84% of capacity, 153% of the 12,785 MW record peak); ~8,150 MW more claimed off-grid (Wonder Valley 7,500, Mihta Askiy 650) | Meta $13B+, 300 operational and 3,000+ construction jobs, ~$250M/yr provincial-revenue claim; compute levy from Dec 2026 |
| Saskatchewan (SaskPower) | 6,191 | 300 MW committed (4.8%; 7.7% of the 3,910 MW record peak) | None published beyond Bell; no queue disclosed | Bell $1.7B initial inside a claimed $12B of long-term value (~$10B of it tenant hardware); 80+ permanent, 800+ construction jobs |
| Manitoba (Manitoba Hydro) | 6,074 | ~20 MW operating (~0.3%): eight small datacenters, largest 7.5 MW | 13 connection requests, megawatts undisclosed, one with a signed contract; the rejected farmland proposal ran to hundreds of MW | None on the record |
| Ontario (IESO grid-connected) | 37,760 | ~312 MW operating colocation, Toronto market (0.8%) | ~1,800 MW forecast-admitted (4.8%); ~6,700 MW proposed across all likelihood tiers (17.7%) | Microsoft's $19B Canada commitment ($7.5B over 2026-27); Cohere's $725M project with up to $240M federal at the CoreWeave-operated Cambridge site |
| Quebec (Hydro-Québec fleet) | 37,369 | ~200 MW subscribed (0.5%) | 1,102 MW allowed at winter peak by 2035 (2.9%); requests an unquantified subset of the 13,605 MW all-sector list | QScale ~$500M invested with $700M more planned; Google's $735M Beauharnois awaiting allocation |
| New Brunswick (NB Power) | 3,772 | 0 | 200 MW grid draw of the 390 MW Lorneville project (5.3%), plus 190 MW on-site gas outside the basis | Beacon/VoltaGrid $2B; 210 permanent claimed (above benchmark, unverified), 1,200-1,300 construction |
| Nova Scotia (province-wide) | 2,839 | 0 | None; any datacenter deferred until Wind West and new supply operate | — |
| PEI (province-wide) | 441 | 0 | None | — |
| NL (province-wide) | 8,682 | 0 | One unnamed wind-to-hydrogen proponent's concept (single source) | — |
How the placements were scored
The Transmutarianism framework scores agents on F (filtering of deprivation: deprivation absorbed without being passed on) and A (amplification of fulfillment: fulfillment emitted in excess of what was received). Moral work M = [τF + A] / √(τ²+1) (at the Conduit origin F₀ = A₀ = 0) is computed per Maslow level (physiological, safety, belonging, esteem, actualization) and weighted by w = {5, 4, 3, 2, 1}. The normalizer keeps M comparable across τ settings; a power coefficient ρ can raise the bar for powerful agents. Per-level M and w·M below are on the unit scale; aggregate dot coordinates stretch to the −100/+100 axis by (Σw·F / 15) × 10.
Assumptions, stated
- Scope of evaluation. The evaluated agent, per province, is the provincial datacenter-power regime: the government and its grid operator or Crown utility acting together on datacenter connection, allocation, rate, and enabling-generation policy, as constituted July 2026. Seven provinces are scored. Nova Scotia, PEI, and Newfoundland and Labrador are excluded because no datacenter regime exists to score; each is material to the comparison and appears in the tables.
- Two scores: present and future. W(present) sums the present-need flows (deprivation relief and present fulfillment). W(future) is the all-in total once the future-need flows are added (domestic compute capacity, economic growth, frontier capability), with the future contribution shown separately below each table so it never buries a present harm. Both are reported; the present-vs-future balance is a disclosed value choice.
- Flow classification. Every flow is booked once at its Maslow level per the mapping table above; a flow's benefit and its deprivation share a level. Generation books both sides: the emissions harm at physiological, and the delivered-energy fulfillment reaching residents as the symmetric benefit partner, gated by a saturation cap on a rich grid and a denominator guard that sets the credit to 0 for load a datacenter tenant captures. Construction employment books present at safety, gated and netted against concurrent rate harm; economic growth splits, with realized household income present at safety and growth as such at actualization/future. Investment cheques, GDP totals, and unallocated Crown revenue are context, never scored as F or A; what a build delivers (capacity, jobs, income) is scored, and hyperscale operations jobs are thin (0.2-0.4 FTE/MW).
- Denominator. Each regime is scored on flows to its own province's residents: households, existing ratepayers, and affected communities including Indigenous Nations. Excluded from the ledger: proponent shareholders, export customers, other provinces. Domestic compute capacity is credited to residents as strategic future capacity built on their soil.
- Domestic compute capacity. Credited by the scale of capacity built on Canadian soil, regardless of operator: a foreign hyperscaler's Canadian datacenter builds domestic strategic capacity as much as a national champion's, so no sovereignty deficit is booked for foreign ownership. Executed and committed capacity is credited; proposals that are not built book little.
- Maslow weighting. w = {5, 4, 3, 2, 1} are Maslow-inspired ordinal priority weights, the framework's normative choice, not a cardinal formula from Maslow. The sensitivity set is reported: flat {1,1,1,1,1}, steep {16,8,4,2,1}, and a threshold-priority test in which severe present physiological deprivation cannot be offset by any higher-level or future benefit.
- F and A scale. Each level scored −10 to +10, central estimate from the sourced record; the reasoning column names the inputs. Substitute different values with a source and the dots move.
- Asymmetry coefficient (τ). Default τ = 1; sensitivity at τ = 0.8 and τ = 1.5 in the math box. Every present sign holds across the band.
Per-province scoring
Each regime carries two scores. W(present) sums the present-need flows (deprivation relief and present fulfillment); W(future) adds the future-need flows (domestic compute capacity, economic growth, frontier capability) as an all-in total, with the future contribution shown separately below each table so it never buries a present harm. Each F and A is the central estimate from the sourced record, scored −10 to +10; w·Mₙ = w·(F+A)/√2 at τ = 1, unit scale.
Which need each flow serves (the mapping)
| Flow | Maslow level (w) | Scored in |
|---|---|---|
| Air-pollution exposure & health burden; freshwater & water stress; life-supporting ecology; habitable shelter; thermal-survival heat; delivered energy services reaching residents (benefit side, symmetric partner of the emissions harm, gated); outage-attributable mortality | Physiological (5) | Present |
| Electricity affordability & rates and grid reliability (two-sided: delivered vs stressed); tenure security; Indigenous consent / FPIC; protection from coercive decisions; jobs as livelihood; construction employment (gated, netted); income reaching households | Safety (4) | Present |
| Meaningful community participation & inclusion | Belonging (3) | Present |
| Reputational prestige / recognition (only where recognition is the measured flow) | Esteem (2) | Present |
| Frontier research & capability; economic growth as such and above-decent-living durable capacity; domestic compute capacity (capability) | Actualization (1) | Future |
| Domestic compute capacity built on Canadian soil (strategic autonomy, by MW, any operator, partial-dependence discount where the stack is foreign) | Safety (4) | Future |
| Durable economic capacity, security-of-livelihood-base slice (traced, not the investment total) | Safety (4) | Future |
Investment totals, GDP, and unallocated Crown revenue are booked as context, never as F or A; domestic compute capacity is credited by the scale built on Canadian soil regardless of operator (a foreign hyperscaler's datacenter builds domestic strategic capacity too), and W(present) is always reported so a large future figure cannot launder a present harm.
The non-duplication test: when one megawatt emits two flows
Two credits attach to one physical asset without double-counting only when they are distinct needs for the same population, or the same need for distinct populations. A megawatt is booked once per need it serves, and earns a second entry only where it demonstrably serves a second, different need.
- Domestic compute capacity (safety-future and actualization-future). A cluster reduces external dependence (a security good, safety) and expands frontier research capability (an actualization good). Different needs; the evidence is split across the two rows and neither counts the other's contribution. A cluster that only reduces dependence, with no research access, earns the safety row alone.
- Electricity (physiological delivered-energy and safety reliability). Warmth, light, and refrigeration keep residents alive (physiological); a reliable, affordable supply is a distinct security-of-supply and cost good (safety). A megawatt delivered to a home earns both only where both outcomes are documented; where only reliability is shown, the physiological row stays 0, and the saturation gate keeps the physiological credit small on a rich grid, so the pair cannot inflate.
- Where it is booked once. A job is a single safety livelihood flow; it earns a separate esteem or belonging entry only where the measured outcome is the identity or community impact of the work, not the paycheck. Jobs, wages, and the household income growth delivers are one safety flow, not three.
The test is symmetric on the harm side: a plant's emissions book once at physiological, whether the plant is called "enabling generation," "firm supply," or "baseload."
The denominator guard, drawn
The evaluation scores flows to a province's own residents. When a datacenter self-supplies its power, the split is asymmetric by construction: the tenant captures the energy benefit and the strategic capacity, both outside the resident denominator, while the emissions, water, and land footprint land on residents inside it.
outside the resident denominator
the denominator this note scores
The benefits that do reach residents are booked where they occur, not withheld: Alberta's recurring compute levy and its shared-grid reliability, Manitoba's repatriated supply, Ontario's export surplus that absorbs load, a documented local-hire share of construction. The guard removes only the credit for energy the resident never consumes; it leaves every channel that genuinely reaches them.
Per-province scoring, all seven regimes (per-level F, A, and w·M)
British Columbia: W(present) = +20.2, W(future) = +27.2 (Transmuter under both)
| Level (w) | F | A | w·Mₙ | Reasoning (present needs) |
|---|---|---|---|---|
| Physiological (5) | −1 | +0.5 | −1.77 | F: residual gas EPA-extension emissions the load growth requires; no coal or water harm. A: delivered clean-hydro energy service reaching residents, the symmetric benefit partner of the emissions harm, gated small and saturation-capped on a ~300 GJ/cap grid. |
| Safety (4) | +4 | +2.25 | +17.68 | F: 400 MW competitive cap + 24-hour curtailability (B.C. Reg. 8/2026) protect grid reliability in a system with +98/+54 MW cushions; permanent crypto ban and competitive price scoring protect rates; Upper Nicola Band FPIC ratified 98-33. A: ~$550M of five-year trading returned to ratepayer households, plus gated construction employment (no large resident rate hike to net against). |
| Belonging (3) | +2 | 0 | +4.24 | Allocation framework scores community benefit; Motion 5 municipal pause defeated; TRU campus participation. |
| Esteem (2) | 0 | 0 | 0.00 | No measured prestige flow; the cluster is scored as capacity, not branding. |
| Actualization (1) | 0 | 0 | 0.00 | Frontier capability is a future-need flow (below). |
| W(present) | +20.15 | Net moral work on present needs at τ = 1. The Foundation is based in BC; the exposure is disclosed. |
Future capacity (+7.0): +2.1 safety (~178 MW of executed domestic compute as strategic autonomy, net of the growth durable-capacity slice and the sovereignty partial-dependence discount) and +1.5 actualization (60,000-GPU cluster capability, Bell AI Fabric access, growth), giving W(future) = +27.15.
Alberta: W(present) = −8.1, W(future) = +4.6 (present Magnifier performing negative work; crosses positive with future capacity, thinly and only at τ ≤ 1)
| Level (w) | F | A | w·Mₙ | Reasoning (present needs) |
|---|---|---|---|---|
| Physiological (5) | −4 | +0.5 | −12.37 | F: EA exemptions (Wonder Valley, Synapse); 24M m³/yr water certificate in a water-stressed region; 932 MW unabated gas CCGT (~3 Mt CO2/yr) as air-pollution and health burden. A: a gated delivered-energy credit for the integrated AESO pool serving residents, capped small; the Meta self-supply gas serves the tenant, so under the denominator guard its power books 0 to residents while its emissions stay counted here. |
| Safety (4) | −2 | +2 | 0.00 | F: CER emissions-filter suspension (Nov 2025 MOU) + renewables restrictions channel new firm supply to gas; Sturgeon Lake Cree FPIC/consultation absent on Treaty 8; offset by the AESO 1,200 MW reliability cap. A: BYOG self-supply, Meta's ~300 operations jobs and gated construction employment (3,000+) as thin livelihood, Woodland Cree-led 650 MW Mihta Askiy. |
| Belonging (3) | 0 | +1 | +2.12 | A: municipal support required in AESO qualification (community participation). |
| Esteem (2) | 0 | +1.5 | +2.12 | A: "largest executed buildout in Canada" as reputation (the investment and revenue dollars are context, not scored). |
| Actualization (1) | 0 | 0 | 0.00 | Frontier capability is a future-need flow (below). |
| W(present) | −8.13 | Net moral work on present needs at τ = 1. |
Future capacity (+12.7): +4.0 safety (1.2 GW of executed domestic compute, the largest of the seven, as strategic autonomy, credited by scale regardless of the US operator, with the growth durable-capacity slice and the sovereignty partial-dependence discount for the foreign stack netting to zero) and +2.0 actualization (frontier capability and growth), giving W(future) = +4.6: the future contribution outweighs the present harm, which stays fully counted, though the crossing is thin and reverses at τ = 1.5.
Saskatchewan: W(present) = −13.6, W(future) = −5.5 (Magnifier performing negative work under both; future narrows but does not close it)
| Level (w) | F | A | w·Mₙ | Reasoning (present needs) |
|---|---|---|---|---|
| Physiological (5) | −4 | +0.5 | −12.37 | F: seven coal units extended toward 2050; SES-documented health burden (mercury, SO2, particulates); 24% of Canada's electricity-sector GHGs with 3% of population; coal books the heaviest harm per unit under mix-tracking. A: a gated delivered-energy credit for the integrated SaskPower grid serving a cold-province population, capped small; the incremental coal backing the Bell campus books 0 to residents under the denominator guard. |
| Safety (4) | −3 | +2.3 | −1.98 | F: $2.6B refurbishment and 3.9% + 3.9% rate increases pending (affordability); allocation by undisclosed bilateral deal with no competitive process (protection from coercive decisions). A: dispatchable-capacity reliability; Bell 80+ operations jobs and construction employment, netted down against the pending rate increases on the same households. |
| Belonging (3) | −1 | +1 | 0.00 | F: the public shut out of an opaque process. A: George Gordon First Nation workforce and procurement MOU, welcomed in the Nation's own material. |
| Esteem (2) | 0 | +0.5 | +0.71 | A: legally-undefined "sovereign AI" branding as thin reputation (the $12B value claim and Crown bill are context, not scored). |
| Actualization (1) | 0 | 0 | 0.00 | Frontier capability is a future-need flow (below). |
| W(present) | −13.65 | Net moral work on present needs at τ = 1. |
Future capacity (+8.1): +2.5 safety (300 MW committed Bell campus as strategic autonomy, growth slice and sovereignty discount netting to zero) and +1.5 actualization (capability and growth), giving W(future) = −5.5: the coal-to-2050 present cost still dominates, so the future credit narrows the deficit without closing it.
Manitoba: W(present) = +29.0, W(future) = +31.0 (Transmuter under both; highest on present needs)
| Level (w) | F | A | w·Mₙ | Reasoning (present needs) |
|---|---|---|---|---|
| Physiological (5) | +4 | 0 | +14.14 | Hyperscale rejection (June 4, 2026) in a system with a 2029/30 capacity need date and drought losses in two of three fiscal years; the load it could not firmly serve was refused rather than passed to households, and the emissions and water demand of that load avoided. |
| Safety (4) | +3 | +1.5 | +12.73 | F: default +100% levy on datacenter and crypto rate classes (SM 2026 c.32) and crypto curtailment protect rates and grid security. A: 500 MW of expiring US exports repatriated for domestic household energy security; wind procurement's Indigenous majority ownership. |
| Belonging (3) | +1 | 0 | +2.12 | Environmental grounds named in the rejection; PUB review with Indigenous interveners (Wa Ni Ska Tan, MKO) as public participation. |
| Esteem (2) | 0 | 0 | 0.00 | No measured prestige flow (a refuser does no buildout bragging). |
| Actualization (1) | 0 | 0 | 0.00 | Frontier capability is a future-need flow (below). |
| W(present) | +28.99 | Net moral work on present needs at τ = 1. |
Future capacity (+2.1): +0.6 safety (~20 MW operating plus a small growth durable-capacity slice; hyperscale refused, so little strategic capacity built) and +0.5 actualization (small compute, smaller datacenters welcome), giving W(future) = +31.0: it leads on present needs and forgoes the future capacity, the trade its refusal makes.
Ontario: W(present) = +14.1, W(future) = +23.2 (Transmuter under both)
| Level (w) | F | A | w·Mₙ | Reasoning (present needs) |
|---|---|---|---|---|
| Physiological (5) | 0 | 0 | 0.00 | No emissions, water, or land harm named for Ontario's grid-connected buildout. |
| Safety (4) | +1 | +2.25 | +9.19 | F: Bill 40 s.28.1 connection filter, enacted but inoperative while regulations are unmade (caps the score); datacenters bear connection costs, moderated by s.78.3's taxpayer shift. A: 18.0 TWh 2025 net-export surplus absorbs load without household scarcity; LT2 Indigenous equity partnerships; Microsoft operations jobs and gated construction employment as thin livelihood. |
| Belonging (3) | +1 | 0 | +2.12 | Local-community benefit named in the prioritization criteria; Mississauga contest unresolved. |
| Esteem (2) | 0 | +2 | +2.83 | A: "largest operating market" as reputation (the Microsoft investment total and GDP are context, not scored). |
| Actualization (1) | 0 | 0 | 0.00 | Frontier capability is a future-need flow (below). |
| W(present) | +14.14 | Net moral work on present needs at τ = 1. |
Future capacity (+9.1): +2.7 safety (~312 MW operating, the largest operating market, as strategic autonomy, net of the growth slice and a sovereignty discount for the CoreWeave US operator) and +2.0 actualization (the one finalized federal sovereign-compute deal at the CoreWeave-operated Cambridge site, plus growth), giving W(future) = +23.2.
Quebec: W(present) = +23.6, W(future) = +30.9 (Transmuter under both)
| Level (w) | F | A | w·Mₙ | Reasoning (present needs) |
|---|---|---|---|---|
| Physiological (5) | 0 | +1 | +3.54 | A: heat recovery priced into the selection criteria (thermal-survival warmth). |
| Safety (4) | +2.5 | +1.6 | +11.60 | F: rationing (956 MW of 2,671 granted) as grid security-of-supply discipline in a no-surplus system; Rate CD ~13¢/kWh and crypto-to-zero price scarcity; net of the Pessamit consent failure (63% no). A: 282 MW of crypto sheds 95% on demand; thin datacenter operations and construction jobs. |
| Belonging (3) | +2 | +1 | +6.36 | F: institutionalized contest at the Régie as a participation venue. A: benefits-per-MW criteria include community spinoffs. |
| Esteem (2) | 0 | +1.5 | +2.12 | A: QScale and the Sherbrooke crypto-to-AI conversion as reputation (investment and GDP are context). |
| Actualization (1) | 0 | 0 | 0.00 | Frontier capability is a future-need flow (below). |
| W(present) | +23.62 | Net moral work on present needs at τ = 1. |
Future capacity (+7.3): +2.2 safety (~200 MW subscribed as strategic autonomy plus a growth durable-capacity slice, explicit digital-sovereignty selection "plus de crypto, tout de l'IA") and +1.5 actualization (Telus Rimouski sovereign capability, growth), giving W(future) = +30.9.
New Brunswick: W(present) = −24.7, W(future) = −23.0 (Magnifier performing negative work under both; deepest of the seven)
| Level (w) | F | A | w·Mₙ | Reasoning (present needs) |
|---|---|---|---|---|
| Physiological (5) | −3 | 0 | −10.61 | 755 kt CO2e/yr (~6.6% of provincial emissions) with 27 ha of wetland infill and old-growth clearing, as air-pollution and life-supporting ecological loss. |
| Safety (4) | −4 | +0.5 | −9.90 | F: 200 MW of grid draw (~7% of record peak) while the capacity gap advanced to 2028; MTI's unresolved unceded-territory assertion and the unanswered Peskotomuhkati letters (Indigenous consent). Offset by NB Power's flexible-load requirement and the crypto ban. A: 210 claimed jobs (unverified) as thin livelihood. |
| Belonging (3) | −2 | 0 | −4.24 | F: a 4,823-signature petition, a judicial review, and a moratorium motion denied a vote (participation and protection from coercive decisions). |
| Esteem (2) | 0 | 0 | 0.00 | No measured reputational flow (the $2B investment is context, not scored). |
| Actualization (1) | 0 | 0 | 0.00 | Frontier capability is a future-need flow (below). |
| W(present) | −24.75 | Net moral work on present needs at τ = 1. |
Future capacity (+1.8): +0.5 safety (Lorneville is proposed, not built, so almost no domestic capacity is executed) and +0.5 actualization, giving W(future) = −23.0: with nothing built yet, the future credit barely moves a deep present deficit.
Sensitivity
The two headline readings are the present split (four positive, three negative) and the future all-in split (five positive, two negative). All present signs hold across the τ = 0.8 to 1.5 band, under flat weights {1,1,1,1,1}, and under steep weights {16,8,4,2,1}; the steep vector widens the split because present physiological harm dominates. The weight vector is the framework's normative choice, so all three are reported.
The present-vs-future balance is itself the central sensitivity: whether future compute capacity should offset present deprivation is a value choice, reported both ways. The aggregative reading (the two headlines) lets demonstrable, executed future capacity offset a fully-counted present harm, and flips only Alberta. The threshold-priority reading holds present drinking-water, air, and land harm prior to any future benefit, and flips no negative to positive. A reader who weighs the levels or the present-future balance differently has the per-level tables and the mapping above to move the dots; substitute a value with a source and the score changes.
Future capability, weighted more heavily
The present-vs-future balance is a value choice, so it gets its own sweep. Weighting the future contribution by a multiplier λ (all-in W = W(present) + λ · future) shows how the ranking moves as a reader values built capacity more.
| Province | λ = 1 | λ = 2 | λ = 3 | λ = 4 |
|---|---|---|---|---|
| Manitoba | +31.0 | +33.1 | +35.1 | +37.2 |
| Quebec | +30.9 | +38.2 | +45.5 | +52.7 |
| British Columbia | +27.2 | +34.1 | +41.1 | +48.1 |
| Ontario | +23.2 | +32.2 | +41.3 | +50.3 |
| Alberta | +4.6 | +17.3 | +30.1 | +42.8 |
| Saskatchewan | −5.5 | +2.6 | +10.7 | +18.9 |
| New Brunswick | −23.0 | −21.2 | −19.4 | −17.7 |
Saskatchewan crosses positive at λ ≈ 1.7; Ontario passes Manitoba at ≈ 2.1 and BC at ≈ 2.9; Alberta passes Manitoba, the top refuser, at ≈ 3.5; New Brunswick stays negative at any plausible weight (it needs λ ≈ 14) because almost nothing is built. A future-weighted reading rewards the builders and penalizes the refuser and the unbuilt, the trade the present/future split exists to expose.
The innovation flywheel
Weighting all future capacity equally treats a megawatt rented to a foreign tenant like a sovereign cluster wired into universities and domestic model firms; the compounding is not uniform. A disclosed flywheel scenario multiplies each regime's future contribution by an ecosystem factor keyed to observable signals: sovereign-compute deals reaching domestic firms, research and talent integration, and domestic model or chip development. Pure tenant-captured hyperscale sits near 1.0; a research-integrated sovereign anchor approaches 2.0.
| Province | Ecosystem factor | Observable basis | Flywheel W(future) |
|---|---|---|---|
| Ontario | 1.8 | Cohere, a domestic frontier-model firm, at the CoreWeave Cambridge sovereign-compute deal; largest operating market | +30.4 |
| Quebec | 1.8 | Telus Rimouski sovereign capability, QScale HPC flagship, explicit digital-sovereignty selection | +36.7 |
| British Columbia | 1.7 | 60,000-GPU Telus cluster, Bell AI Fabric with TRU university integration | +32.0 |
| Manitoba | 1.3 | domestic-oriented but almost no capacity built (~20 MW) | +31.7 |
| Saskatchewan | 1.2 | Bell campus anchors foreign tenants (CoreWeave, Cerebras); "sovereign AI" branding legally undefined | −3.9 |
| Alberta | 1.1 | largest raw capacity, but Meta is a foreign hyperscale tenant on a foreign stack; thin domestic research anchor | +5.9 |
| New Brunswick | 1.0 | proposed only, foreign proponents, no sovereignty component | −23.0 |
The flywheel does not rescue the raw-megawatt builders. Alberta's capacity lead is discounted for a thin, foreign-tenant ecosystem (+5.9, below every positive province) and Saskatchewan stays negative; the provinces that compound are the ones seeding a domestic ecosystem (Ontario, Quebec, BC). This is a more discriminating robustness check than the uniform λ sweep, and it rests on observable ecosystem signals rather than optimism. Both readings are disclosed value choices; neither changes the central present-needs verdict.
Calibration and inter-rater reliability
To test how much of the ordering is forced by the evidence rather than by one scorer's judgment, the seven present-flow regimes were coded three times: the published scores, and two blind re-derivations by scorers who saw only an observable-anchor rubric and an evidence dossier, never the published numbers or each other. Sign and quadrant are rater-invariant. All three produce the same four-positive (BC, Manitoba, Ontario, Quebec) and three-negative (Alberta, Saskatchewan, New Brunswick) split, all seven provinces sign- and quadrant-stable, with Kendall's W = 0.91 and Pearson r = 0.95 between the primary and each blind rater; 25 of the 35 per-level cells (71%) agree within ±1 across all three. Where they diverge, the two blind raters score the negative provinces harsher than the published numbers (Alberta −24 to −29 against the published −8.1; New Brunswick −41 against −24.7), so the published scores are the conservative end of every contested cell, not an advocate's.
Observable anchors, agreement statistics, and residual scorer judgment
Each rater keyed the sign and rough magnitude of every cell to a concrete, checkable quantity or status.
| Dimension (weight) | Observable anchor | Where judgment still enters |
|---|---|---|
| Physiological F (5) | emissions by generation mix (coal > gas > hydro/nuclear, mortality-anchored); freshwater withdrawal under stress; land converted; a refusal books the avoided harm positive | summing same-sign sub-flows to the level cap vs a netted band |
| Physiological A (5) | delivered-energy credit, saturation-capped |A| ≤ 1, set to 0 for tenant-captured load | size of the marginal above-saturation credit |
| Safety F (4) | reliability + affordability + FPIC/consent + process, netted in one cell, ±10 cap | sum to the cap vs a band; consent-netting when one Nation partners and another litigates |
| Safety A (4) | gated construction and operations employment; delivered reliable, affordable electricity | magnitude of the gated credit within a ~1.5-point band |
| Belonging (3) | community participation and inclusion, one netted cell | F-vs-A placement only (cosmetic: M, W, and the dot are unchanged) |
| Esteem A (2) | recognition as the measured flow (branding, largest-market status) | whether hollow branding books recognition at all (0 to +2) |
| Actualization (1) | 0 in the present; compute autonomy and capability are future-only | none, rule-fixed |
Agreement. Kendall's W = 0.91 across three raters and seven provinces; Pearson r = 0.95 primary-vs-blind and 0.998 blind-vs-blind; 25 of 35 cells (71%) within ±1 across all three on both F and A, 57 of 70 F/A components (81%); mean absolute deviation 0.25 per component. The two blind raters agree with each other far more tightly (34 of 35 cells) than either matches the primary, so the three-way spread is bounded by the primary's mildness, not by the blind raters diverging. Sign and quadrant agreement is 7 of 7.
| Province | Primary | Blind A | Blind B | Sign / quadrant |
|---|---|---|---|---|
| British Columbia | +20.2 | +41.4 | +39.2 | + Transmuter (stable) |
| Manitoba | +29.0 | +37.5 | +37.5 | + Transmuter (stable) |
| Quebec | +23.6 | +15.6 | +12.7 | + Transmuter (stable) |
| Ontario | +14.1 | +15.2 | +15.2 | + Transmuter (stable) |
| Alberta | −8.1 | −29.3 | −24.4 | − Magnifier (stable) |
| Saskatchewan | −13.6 | −20.2 | −20.2 | − Magnifier (stable) |
| New Brunswick | −24.7 | −41.0 | −41.0 | − Magnifier (stable) |
Where scorer judgment still enters. The rubric fixes the sign of every cell and the sign and quadrant of every province; three magnitude choices remain open, and that is where the spread lives. First, whether same-sign sub-flows are summed to the ±10 level cap or booked as a netted band: the primary nets, both blind raters sum, which is the whole of BC's 21-point range (reliability + affordability + FPIC + process sum past the cap). Second, how to net consent when one Nation partners while another litigates (Alberta), the single cell where even the two blind raters disagree. Third, the size of the gated employment and delivered-electricity credits within about 1.5 points. A fourth, whether participation books as F or A at belonging, is cosmetic: at τ = 1 both placements yield the same M, so they move the F and A columns without moving W or the dot. Readers who want the harsher magnitudes can take the blind consensus; the published numbers are the milder end of every contested cell, and the direction of every flow, the sign of every province, and the four-three split are rater-invariant.
The audit protocol
An audited placement for any province or project requires the following inputs; the Foundation offers framework, scoring template, methodological support, and the published report to any party willing to supply them.
- The connection or allocation register: applicants, megawatts requested and granted, and selection scores.
- Utility service agreements for each datacenter: rate class, demand pattern, curtailability terms, any private offsets.
- Enabling-generation attribution: which new or extended generation serves the load, at what capital cost and emissions intensity.
- Community-benefit infrastructure measured at delivery: recovered heat in GWh/yr, water withdrawals in m³/yr, acoustic reports, backup-fuel inventories.
- Long-term FTE counts by site and role, net-new versus relocated, plus construction person-hours.
- Community Benefit Agreement and Indigenous agreement terms with dollar values, each line Maslow-tagged, and the consent record (votes, assessments, litigation status).
Contact: sev@economyofwisdom.com.
The math is at transmutarianism.org/framework/. The live quadrant explorer is at transmutarianism.org/quadrant/. To dispute any placement, substitute different F and A values per level, with a source for each, and the dot moves. The repository carries a machine-readable score ledger (every per-level F and A, all sensitivities, and the inter-rater ranges, as JSON), the assumption-challenge ledger, and a link checker run before publication.