BC's biggest university does the most. Its smallest Indigenous college does the most per public dollar.
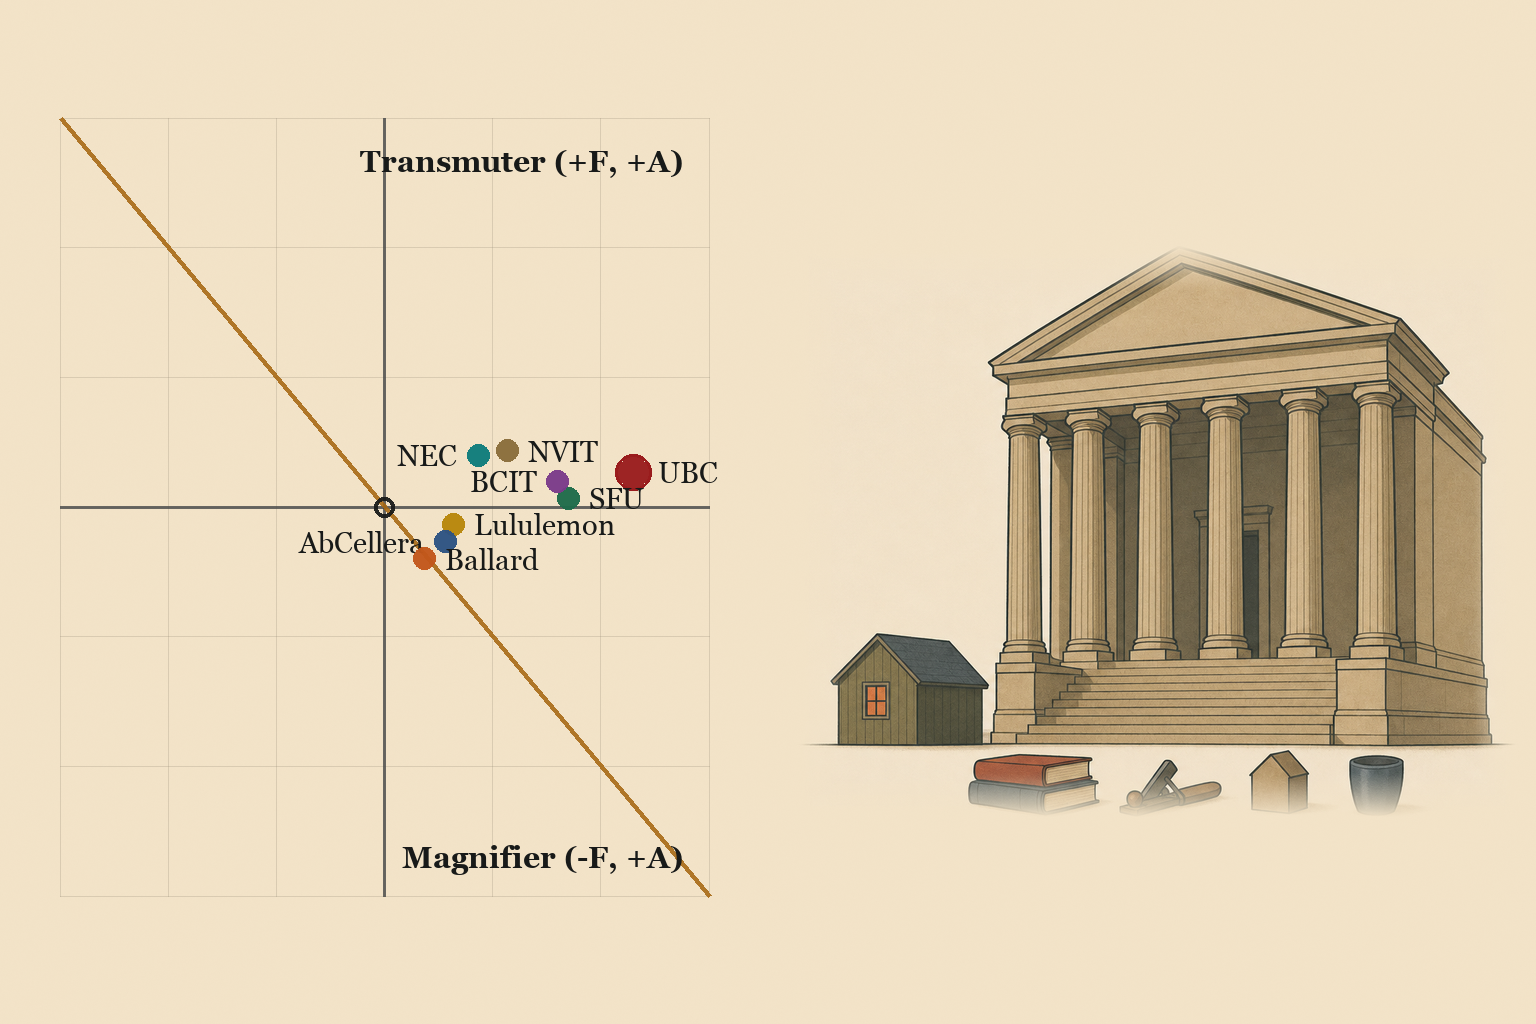
Rankings measure prestige and financial statements measure money; this report measures what neither captures, the deprivation an institution absorbs before it reaches residents and the fulfillment it emits in return. Eight British Columbia organizations, five education institutions and three private firms, scored against the same population on the same map. The five schools place as Transmuters and the three firms as Magnifiers, driven by student housing and payroll, which this framework weights heaviest. Divide the identical scores by the public money each received and the ordering inside the public system reverses exactly by size: Native Education College returns 4.893 units of net moral work per million dollars of public transfer, against UBC's 0.031. Both numbers come from the same table and answer different questions. That inversion is mostly arithmetic: public transfer across the five schools ranges 324-fold while their scores range about 2-fold, so the ratio tracks scale more than efficiency.
Headline finding
Five Transmuters, three Magnifiers; Ballard alone is net negative. W is the framework's single weighted measure of net relational work. At τ = 1 against a British Columbia resident denominator: UBC W = 54.45 (F = +5.33, A = +46.00); BCIT W = 38.18 (F = +4.00, A = +32.00); SFU W = 37.48 (F = +1.33, A = +34.00); NVIT W = 33.23 (F = +8.67, A = +22.67); Native Education College W = 26.87 (F = +8.00, A = +17.33). Lululemon W = 10.61 (F = −2.67, A = +12.67); AbCellera W = 6.36 (F = −5.33, A = +11.33); Ballard Power W = −0.71 (F = −8.00, A = +7.33).
The education institutions place above the firms because two heavily weighted rows run their way. Student housing beds book at the physiological level, weight 5, where UBC operates 14,095 beds at Point Grey and all three firms operate none. Payroll and credentials book at the safety level, weight 4, where UBC pays $2,434,526K in wages and benefits and Lululemon discloses no total wage figure in any jurisdiction.
The two Indigenous-serving institutions carry the highest filtering scores on the roster, NVIT at +8.67 and Native Education College at +8.00, because both absorb educational deprivation for Indigenous learners, 82% of NVIT's domestic full-time-equivalent enrolment and an NEC intake that rose from 140 in 2022/23 to 357 in 2024/25. Neither appears in any published debt-at-graduation series.
Ballard Power is the only subject at negative net present work, and its sign is unstable across the disclosed τ band: W = +1.09 at τ = 0.8 and W = −0.71 at τ = 1.0, crossing zero at τ = 0.917. Its negative placement depends on which civic value is in play.
Where the eight sit on the quadrant
The Transmutarianism map places any agent by what it does to the need that passes through it: whether it filters deprivation (F) and whether it amplifies fulfillment (A). The signs of F and A place it in one of four quadrants: Transmuter, Absorber, Magnifier, Extractor. In plain terms: a Transmuter absorbs deprivation and sends fulfillment back; an Absorber soaks up deprivation but emits little fulfillment; a Magnifier emits fulfillment while letting deprivation pass through; an Extractor amplifies deprivation and absorbs fulfillment. On this roster only the Transmuter and Magnifier quadrants are occupied.
The chart below plots all eight subjects against a British Columbia resident denominator. Drag the τ slider to test sensitivity. Click any dot for its F, A and M values.
Every education institution sits above the horizontal axis and every firm below it. Positive filtering means the subject absorbs deprivation that would otherwise pass through to residents; the schools house students, train them into work, and carry the cost of doing so. Negative filtering means deprivation passes through; the firms hold land or lease it, employ people, and pass the rest of the need onward. All eight sit to the right of the vertical axis, so all eight emit more fulfillment than they absorb.
A spans +7.33 to +46.00 across the eight; F spans −8.00 to +8.67. The subjects differ more in how much fulfillment they emit than in how much deprivation they absorb.
The per-level scoring, the stated assumptions, the sensitivity math and the alternative constructions are in How the placements were scored at the end of this note.
Public-interest recommendations
These follow from the finding and from one gap: the jurisdiction containing the UBC campus alone carries $9,144,226,650 of exempt assessed value, and no public body publishes the annual revenue foregone.
For the Province of British Columbia
- Publish the annual revenue foregone through the statutory property-tax exemption for universities and colleges, by institution. The Budget and Fiscal Plan's tax-expenditure appendix currently states that estimates for colleges and similar public facilities "are not shown". The City of Vancouver publishes $307.0 million of forgone general-purpose taxes for its own exempt roll.
- Bring sections 1 through 13 of the First Nations Mandated Post-Secondary Institutes Act into force. The Act was passed and assented on 16 May 2024 and has had no operative effect for twenty-six months, while the funding it would stabilise continues to run on annual applications.
- Extend the BC Student Outcomes survey to Private Training Act institutions. The two roster subjects with the strongest per-dollar performance are the ones the Province surveys least, and the sector it does not survey at all serves students whose outcomes are collected by nobody.
- Require every public post-secondary institution to file a Statement of Financial Information. The College and Institute Act s.54 already applies the Financial Information Act to NVIT, which files none, while UBC and SFU do.
For BC Assessment
- Publish exempt-roll valuations at folio level alongside taxable ones. The values exist and were obtainable here only through a jurisdiction-level open dataset and a property-by-property portal that returns assessed values for exempt parcels while displaying no exemption status.
For municipalities hosting exempt campuses
- Report statutory exemptions in the annual report alongside permissive ones. Burnaby itemises its permissive exemptions to the dollar and reports its taxable base "excluding valuations for exempt properties", so the two largest exempt landholders in the city appear nowhere.
- Disclose grants-in-lieu by payer. Burnaby's 2025 aggregate of $7,763,000 carries no payer breakdown, and both enabling provisions make payment discretionary, so a genuine zero and an undisclosed payment are indistinguishable.
For the institutions and firms scored
- UBC and SFU: publish the land-development arms' standalone financial statements. UBC Properties Trust carries $1,107,302K of liabilities and files nothing publicly; SFU Community Trust publishes no standalone statements. These entities are the mechanism by which granted public land becomes market housing and endowment.
- Lululemon: disclose total wages and benefits, and British Columbia headcount. Six of the eight subjects publish an audited payroll figure; the largest private employer on the roster publishes none in any jurisdiction.
- AbCellera: publish the employment covenants in the federal and provincial contribution agreements. Every numeric target is redacted from both public copies, so CAD $475.6M of committed public money carries no verifiable obligation on the public record.
- Native Education College: publish the audited financial statements the board accepted at its 18 September 2024 annual general meeting. Every figure scored here rests on a self-reported CRA information return.
What this evaluation is
The Foundation publishes a measurement framework called Transmutarianism. It scores any agent on what it does to the flows of need passing through it: deprivation absorbed, deprivation emitted, fulfillment emitted, fulfillment absorbed. The output is a position on a four-quadrant map and a single weighted number, W, capturing net relational work.
Reasonable people will weight these trade-offs differently. The scoring is transparent and partly normative, and the purpose is to make the trade-offs visible and measurable rather than to deliver a verdict. Every empirical claim below links to its primary source, and every number on this page is produced by a published derivation script in the repository. The figures in the at-a-glance table are the observed record; the per-level scores in the appendix are the framework's reading of that record.
Two features of the instrument bear directly on a comparison involving universities, and both are stated here rather than in the appendix. First, the framework weights housing and employment at 5 and 4 and weights research and frontier capability at 1, so a research university's most distinctive output is weighted lowest by construction, before any evidence about any university is read. Second, the canonical flow table carried no row for education delivered, which is the primary output of five of these eight subjects; three replacement rows were derived for this note and are stated in the appendix, pending author adoption.
The eight at a glance
The roster spans the range the framework is built to test: five education institutions (two research universities, a polytechnic, and two Indigenous-serving institutions) and three private firms in biotech, apparel and clean-energy manufacturing, all drawing on the same British Columbia public base. Lululemon, AbCellera and Ballard are cross-sector comparison cases rather than educational peers, included to test whether purpose, scale or public subsidy best explains the pattern. The eight bracket that proposition as a purposive sample, so no finding here generalizes to the sector.
| Subject | Public transfer received | Property tax | Student beds | Wages and benefits | Research spend |
|---|---|---|---|---|---|
| UBC | $1,781,169K, all levels | Exempt (University Act s.54(1)) | 14,095 Point Grey, 2,120 Kelowna | $2,434,526K | $739,668K (rank 4 of 50) |
| SFU | $467,761K | Exempt (University Act s.54(1)) | 2,227 | $666,908K | $158,690K (rank 19 of 50) |
| BCIT | $194,591K provincial | Exempt (College and Institute Act s.58) | 799, plus 469 opened August 2025 | $315,800K | Absent from the FY2024 top 50 |
| NVIT | $13,569K provincial | Exempt (College and Institute Act s.58 via s.50) | 80 at Merritt | $13,370,705 | None |
| Native Education College | $5,492K, 81.1% of revenue | $651 paid on $13,358,500 assessed | None | $4,199,955 | None |
| AbCellera | CAD $23.0M provincial cash of CAD $475.6M committed | $3,272,032 across three parcels | None | US$132.8M globally, US$55.8M of it stock-based | US$186,829K R&D |
| Lululemon | CAD $0 provincial and federal | $906,954 across two parcels | None | Not disclosed in any jurisdiction | None |
| Ballard Power | CAD $325K provincial; CAD $2,886,065 cumulative federal | Owns no land; incidence undisclosed | None | $84,978K globally | $58,741K R&D |
Land and the exemption nobody prices
The jurisdiction containing the UBC campus carries $9,144,226,650 of exempt assessed value, comprising $2,307,574,650 of land and $6,836,652,000 of improvements, against $6,762,149,718 of net taxable value in the same jurisdiction, on the 2026 revised roll. SFU's Burnaby Mountain campus folio assesses at $1,634,792,000 and BCIT's main Burnaby folio at $571,794,000. Native Education College pays $651 on a $13,358,500 assessment; a comparable taxable property on the same block, near-identical in size and assessed value, pays $173,967.
UBC's land is not uniformly exempt. Within the same jurisdiction, 4,795 leasehold residential strata folios carry $6,124,394,200 of actual value at zero exemption. The market housing built on granted university land pays full municipal freight; the institutional core does not.
What no public body produces is the cost. British Columbia's tax-expenditure reporting states that estimates for colleges and similar public facilities "are not shown". Burnaby reports its taxable base "excluding valuations for exempt properties" and itemises only its permissive exemptions, so SFU's $1,634,792,000 folio and BCIT's $571,794,000 folio appear nowhere in the schedule. The City of Vancouver, by contrast, publishes $60.28 billion of exempt assessed value, $307.0 million of forgone general-purpose taxes and $37.2 million of offsetting payments-in-lieu for 2024.
This note therefore scores the legal treatment and publishes the assessed values as scale, and does not put a dollar figure on the annual exemption.
Public money, and what is committed against what arrives
UBC recognised $1,781,169K in government grants and contributions across all levels; SFU $467,761K; BCIT $194,591K in audited provincial grant revenue; NVIT $13,568,762; Native Education College $5,491,888, which is 81.1% of its total revenue.
On the private side the announced figures and the arriving figures diverge. AbCellera holds CAD $475.6M in committed government contributions, of which CAD $23.0M of provincial cash appears in the BC Public Accounts payee schedules and approximately US$135M remains undrawn. Ballard Power announced a US$94M United States federal package that was realized at zero, and signed a European Innovation Fund agreement of up to €113M against which nothing has been drawn. Lululemon received CAD $0 in provincial and federal transfers, a figure whose floor is set by the $25,000 Public Accounts disclosure threshold rather than by an audit.
Ballard's disclosed Canadian federal support since 2008 totals CAD $2,886,065 across 25 records.
Labour, and the one employer that will not say
Seven of the eight subjects publish a total wage figure, and six of those are audited: NEC's comes from a self-reported CRA information return. UBC pays $2,434,526K in salaries and benefits across 20,662 faculty and staff, plus $92,748,941 in employer Employment Insurance and Canada Pension Plan contributions. SFU pays $666,908K, BCIT $315,800K, NVIT $13,370,705 and Native Education College $4,199,955. AbCellera reports US$132.8M in total compensation, of which US$55,792K is stock-based rather than cash reaching households, and Ballard $84,978K.
Lululemon discloses no total wages and benefits figure in any jurisdiction. Its published compensation data consists of a median employee total compensation of US$26,179 against a chief executive total of US$24,023,294, a ratio of 918 to 1. British Columbia headcount is undisclosed for all three firms; the BC Pay Transparency Act headcount field is a whole-employer band, which Ballard demonstrated by reporting 300 to 999 against a global workforce of 882 at 31 December 2024.
Ballard's headcount fell from a 1,367 peak in 2021 to 492 at 31 December 2025. No filing breaks that reduction down by site, and none states the aggregate; the figure is a four-year peak-to-trough difference and is labelled as one here. Two of Ballard's three global manufacturing plants and all six of its executive officers are in British Columbia.
No per-job or per-hectare ratio is published in this note. SFU's own two published employment denominators differ by 86% on the same payroll, UBC computes employee full-time-equivalents and restricts them behind an internal network, BCIT's full-time and part-time split cannot be converted, and Native Education College publishes no full-time-equivalent count.
Students, and what they carry away
Median bachelor's salary at the institution level runs BCIT $80,000, NVIT $78,000, UBC $70,000 and SFU $64,000. Median debt at graduation, counted among borrowers only, runs UBC $30,000, SFU $26,537 and BCIT $20,000. BCIT reports the highest salary and the lowest debt of the three largest publics; UBC reports the highest debt on the middle salary.
In the same dataset, certificate and diploma graduates report hourly rather than annual earnings, so these bachelor's-only figures omit BCIT's and NVIT's certificate and diploma graduates, who are the larger part of both institutions' output.
Native Education College is absent from the BC Student Outcomes dataset as a Private Training Act institution, and for the private career college sector these figures are neither collected nor published. NVIT appears in the dataset, and no debt figure is published for it.
The one measure spanning public and private institutions on a single basis is the BC student loan default rate, and it is fifteen years old: a 16.0% median across 167 private institutions against 11.1% across 25 public ones, from the FY2007/08 to FY2011/12 cohort, never extended. Native Education College sits at 54.3% in that dataset, the second-highest of the 167. The cohort predates an enrolment rise from 140 in 2022/23 to 357 in 2024/25, and the figure is not scored as current. It is the roster's strongest disconfirming datum.
Ethical implications: consent, and who was asked
All eight subjects operate on territory subject to Indigenous claims. UBC's only published Musqueam instrument is a 2006 Memorandum of Affiliation whose clause 13 disclaims legal effect and which terminates on 60 days notice, carrying no land, revenue, governance seat or consent provision; UBC's president stated an intention to move to a comprehensive relationship agreement in 2019 and none has been published in the twenty years since the memorandum. SFU holds a 2023 Tsleil-Waututh Relationship Protocol whose text neither party publishes, with annual review as its only stated mechanism. BCIT holds nothing from any Nation.
UBC's own planning documents record that the Point Grey site decisions were made without Musqueam knowledge or involvement. Squamish Nation states in its own published words that UBC and SFU "do not offer significant supports for Indigenous learners."
NVIT was founded in 1983 by the five First Nations of the Nicola Valley and all eight of its appointed board seats carry First Nation affiliations, with the Province appointing from nominations the board itself submits. Native Education College is governed by nine elected directors with a Musqueam councillor serving as its president.
For the three firms, sweeps of Musqueam, Squamish and Tsleil-Waututh's own websites and of the three Nations' joint development corporation return no published instrument of any kind. Kwikwetlem could not be tested because its site directs automated agents not to crawl it, and that absence is recorded as untested rather than as a zero; it matters most for Ballard, whose Burnaby site sits within Kwikwetlem's asserted territory. Ballard is the only firm with an affirmative instrument of its own: a 2024 sustainability report acknowledging that its Burnaby operations sit on the ancestral and unceded lands of the həņq̧əmiņəm̧ and Sḏwx̲wú7mesh speaking peoples. That text names language groups rather than Nations, appears nowhere in its filed Annual Information Form, and sits at the lowest position on both axes of the report's own materiality matrix.
The sector that is regulated and never counted
British Columbia's PTIB-regulated private career college sector was rostered as an eighth scored subject and demoted to context during research. Native Education College is itself certified under the same regime and sits inside the sector's own default-rate dataset, so scoring both would have placed one subject on the board twice.
No statutory exemption reaches the sector, so its institutions pay full commercial property tax. Its regulator collects institution-level tuition revenue and international-enrolment share under B.C. Reg. 140/2016 and publishes neither. Its Student Tuition Protection Fund has gone five fiscal years without published statements while continuing to pay claims. Its students' outcomes are collected by nobody. Its net cost to the Province is $1,000, being $5,211,000 of gross operating expense against $5,210,000 of external recoveries, because the sector funds its own regulator.
What changes the placement
Toward Transmuter: a firm disclosing British Columbia payroll and headcount would let its safety row be scored on its full conduct rather than on the proxy the public record allows. AbCellera publishing its employment covenants would convert CAD $475.6M of committed public money into a verifiable obligation. Any subject reaching a published, binding consent instrument with a host Nation would move its safety filtering score. An evaluation of Lululemon's 2,600-job LMIA commitment, published by either government, would price the only non-cash support on the roster attached to a numeric target.
Toward Extractor: a university monetising further granted land into market housing without a corresponding increase in below-market supply would deepen its physiological diversion. A continued fall in Ballard's British Columbia employment would push its already-negative safety filtering further down. Sustained tuition growth of the kind BCIT recorded at 25.2% year over year, absent a matching increase in institutional aid, would raise the debt emitted per graduate.
Decisions this note is watching: whether sections 1 through 13 of the First Nations Mandated Post-Secondary Institutes Act are brought into force; whether the Province publishes the exemption's cost; whether BC Student Outcomes is extended to Private Training Act institutions; whether NVIT files a Statement of Financial Information as the Financial Information Act requires of it; and whether Native Education College publishes the audited statements its board accepted in September 2024.
Better data moves the dot.
A note on framing
This note began from a proposition: that universities accumulate large privilege up front, that well-resourced institutions have little incentive to change, and that the most efficient operators come from environments of scarcity. The roster was built to test that proposition rather than to illustrate it, which is why it includes a long-subsidised private firm that could fail on the private side and a scarcity-side institution carrying the roster's worst published outcome datum.
Per public dollar received, the ordering inside the public system inverts by size and the two smallest institutions lead the roster. On contribution to British Columbians, the largest university does the most. The split falls between education institutions and firms rather than between public and private: Native Education College, regulated under the Private Training Act, places above all three firms.
Before publication the note's headline pattern was tested against three rival explanations and a scorer-artifact rival, under the protocol the Foundation applies whenever a preferred explanation is supplied. The supplied explanation came last. Scarcity was contradicted by ten of the twenty-one diagnostic evidence items, more than any other reading, and its antecedent is removed by the strongest Indigenous-published source in the record: the Indigenous Adult and Higher Learning Association's own commissioned research states that per-student operational funding at Indigenous institutes is in line with public post-secondary funding per full-time-equivalent. The constrained institutions are not funded below par per student, so there is no measured efficiency gap for the intensity spread to track, and that spread is in any case largely arithmetic.
The reading contradicted by fewest items is chartered purpose. Statute cuts the roster along the same line the quadrant does, exempting UBC and SFU under University Act s.54(1), BCIT and NVIT under College and Institute Act s.58, and Native Education College under an inferred charitable head in the Vancouver Charter, while reaching no private career college delivering the same service. The pair that decides it runs against resourcing: Lululemon books F = −2.67 on CAD $0 of public transfer and Native Education College books F = +8.00 on $5,492K. One rival survives alongside it. A power handicap on the scoring is contradicted by nothing in the record, and $9,144,226,650 of exempt assessed value against $651 of property tax paid is the differential its trigger requires. No single evidence item decides the outcome; the ordering holds when any one of them is withdrawn.
The framework measures the marginal flow contribution of each agent given its own allocation choices. It does not measure blame for systemic conditions, the aggregate state of British Columbians, or the people working inside these institutions. Where an institution scores low here, the recommendation is addressed to the institution and to the governments that set the rules it operates under.
How the placements were scored
The framework scores agents on F (filtering of deprivation: deprivation absorbed without being passed on) and A (amplification of fulfillment: fulfillment emitted in excess of what was received). Moral work M = [τF + A] / √(τ²+1) at the Conduit origin F₀ = A₀ = 0 is computed per Maslow level and weighted by w = {5, 4, 3, 2, 1}. Every figure below is produced by fn11-institutions-derive.py, which passes 15 canon self-tests against the published scoring math.
Undisclosed flows are not scored as zero unless the underlying activity is demonstrably absent. Where a subject's own disclosure prevents a positive contribution from being verified, the limitation is recorded separately and the row is scored on the conduct the record does show. Lululemon is the case in point: its employment fulfillment books at safety A = +4 on a City of Vancouver business-licence proxy of 2,496 British Columbia employees, rather than at zero for the total wage figure it discloses in no jurisdiction. That missing figure is what fuller disclosure could raise; it is carried as a limitation on the audit and does not enter the score as a deficit.
Assumptions, stated
- Scope of evaluation. Eight named British Columbia institutions at their most recent complete reporting year. Explicitly excluded: every other BC public post-secondary institution and every other BC private employer. The roster is a purposive sample built to bracket a proposition, so it cannot support a claim about BC universities in general or BC firms in general.
- Time horizon. Steady state at the most recent complete fiscal year. UBC, SFU, BCIT and NVIT close 31 March 2025; AbCellera and Ballard close 31 December 2025; Lululemon closes 1 February 2026; Native Education College's return covers the period ended 31 March 2024, a full year behind the others. Land granted decades ago is treated as an existing public asset in continuing use rather than as new consumption in the window.
- Asymmetry coefficient (τ). Central τ = 1.0, with sensitivity at 0.8 and 1.5 reported below.
- Maslow weighting. w = {5, 4, 3, 2, 1}, lower-level deprivation heavier. Load-bearing here in a specific direction: the vector places housing and employment at 5 and 4 and research at 1, so a research university's most distinctive output is weighted lowest by construction.
- F and A scale. Each level scored −10 to +10, central estimate, substitutable, every subject on the same scale.
- Denominator. British Columbia residents, chosen because all eight subjects draw on the same BC public resource base and the comparison is only meaningful with the recipient population held constant. Excluded: shareholders and non-BC investors, out-of-province and international students' home communities, export customers, the federal general tax base, and graduates who leave BC. The strongest alternative a critic would choose is a national or global denominator, since universities publish openly and firms sell globally; it is recomputed in the alternatives table below.
- Treatment of diverted resource. Net burden after dedicated offsets, with the existing-public-asset cap applied to land granted decades ago. Both alternatives are recomputed in the table below, and the gross treatment swings three placements across quadrants.
- Power-asymmetry (ρ and ΔM). Central verdict at ρ = 1 (parity), stated. The operational triggers hold unevenly across this roster: UBC, SFU, BCIT and NVIT control land and housing that the denominator population needs, and Lululemon is the larger party by revenue, while Native Education College controls no resource BC residents need and is the smaller party in every audited flow. The handicap would therefore fall on the four public institutions and Lululemon. That includes NVIT, which the tested proposition predicts scores well, so the trigger does not map cleanly onto the proposition; it is disclosed rather than banked.
- Basis of comparison. Not one of the eight standard items, and the most placement-determining choice in this note after the weights. The scale does not itself say whether a cell measures the absolute flow contributed to the denominator or the intensity of that flow per unit of resource consumed. The central dots use absolute contribution, because that is what the published framework states it measures. The intensity construction is computed and published beside them, because the proposition being tested is a ratio claim that the absolute construction cannot answer.
Flow classification: three rows derived for this note
The canonical flow table carried no row for education delivered, which is the primary output of five of these eight subjects. An earlier revision deliberately removed a blanket "educational access" row and did not replace it. Three replacement rows were derived under the canon's own book-once, symmetric and split-don't-merge rules, and are stated here pending author adoption:
| Flow | Level | w |
|---|---|---|
| Credential delivered, employability and livelihood slice (graduate employment access and earnings premium, traced) | Safety | 4 |
| Education delivered, capability slice (knowledge and technical capability beyond the employment channel) | Actualization | 1 |
| Net tuition burden after institutional aid (student debt emitted), the symmetric partner of the employability slice | Safety | 4 |
An institution's own payroll and the credentials it awards are different measured flows and both book at safety; the same person never enters both rows. Under the adopted five-level model the capability slice books at weight 1; an eight-level model with a distinct cognitive tier would place it above esteem and raise it materially, which is run as a sensitivity in the alternatives table below.
Per-level scoring
Per-level M and w·M are on the unit scale. Fagg and Aagg carry the declared ÷15 ×10 display transform.
| Subject | Phys (5) F/A | Safety (4) F/A | Belong (3) F/A | Esteem (2) F/A | Actual (1) F/A | W(present) | W(future) | Fagg | Aagg | Quadrant |
|---|---|---|---|---|---|---|---|---|---|---|
| UBC | +4 / +3 | −3 / +7 | 0 / +6 | 0 / 0 | 0 / +8 | 54.45 | 65.76 | +5.33 | +46.00 | Transmuter |
| BCIT | +2 / +2 | −1 / +7 | 0 / +2 | 0 / 0 | 0 / +4 | 38.18 | 48.08 | +4.00 | +32.00 | Transmuter |
| SFU | +2 / +2 | −2 / +5 | 0 / +5 | 0 / 0 | 0 / +6 | 37.48 | 45.25 | +1.33 | +34.00 | Transmuter |
| NVIT | +1 / +1 | +2 / +3 | 0 / +5 | 0 / 0 | 0 / +2 | 33.23 | 36.77 | +8.67 | +22.67 | Transmuter |
| Native Education College | 0 / 0 | +3 / +3 | 0 / +4 | 0 / 0 | 0 / +2 | 26.87 | 30.41 | +8.00 | +17.33 | Transmuter |
| Lululemon | 0 / 0 | −1 / +4 | 0 / +1 | 0 / 0 | 0 / 0 | 10.61 | 16.26 | −2.67 | +12.67 | Magnifier |
| AbCellera | 0 / 0 | −2 / +3 | 0 / 0 | 0 / 0 | 0 / +5 | 6.36 | 14.85 | −5.33 | +11.33 | Magnifier |
| Ballard Power | 0 / 0 | −3 / +2 | 0 / 0 | 0 / 0 | 0 / +3 | −0.71 | 0.71 | −8.00 | +7.33 | Magnifier |
The alternative construction: moral work per public dollar
The same per-level table, divided by cash government transfers recognised in the window.
| Subject | W(present) | Public transfer ($000) | W per $1M |
|---|---|---|---|
| Native Education College | 26.87 | 5,492 | 4.893 |
| NVIT | 33.23 | 13,569 | 2.449 |
| AbCellera | 6.36 | 23,000 | 0.277 |
| BCIT | 38.18 | 194,591 | 0.196 |
| SFU | 37.48 | 467,761 | 0.080 |
| UBC | 54.45 | 1,781,169 | 0.031 |
| Ballard Power | −0.71 | 325 | −2.176 |
| Lululemon | 10.61 | 0 | undefined |
The largest limit is arithmetic. Across the five education institutions W spans 2.03 to 1 (26.87 to 54.45) while public transfer spans 324 to 1 ($5,492K to $1,781,169K), so dividing the first by the second reproduces the inverse of institution size almost mechanically. The intensity ordering is therefore weak evidence of a difference in conversion efficiency and strong evidence of a difference in size.
Three further limits travel with this column. The ratio is unstable at small denominators, so Ballard's −2.176 reflects a CAD $325K denominator as much as its conduct. Lululemon is undefined rather than infinite: taking no public transfer places it outside the construction rather than at the top of it. The denominator excludes the property-tax expenditure because no public body publishes its annual cost, which would lower UBC's, SFU's and BCIT's intensity further if it could be included.
Where the dots land under the alternatives
These are the standing alternative constructions from the pre-publication assumption gate, recomputed. Any construction that swings a placement across quadrants is disclosed here rather than left in a working file.
| Construction | UBC | SFU | BCIT | NVIT | NEC | Lululemon | AbCellera | Ballard |
|---|---|---|---|---|---|---|---|---|
| Central (net burden, existing-asset cap; BC residents) | 54.45 T | 37.48 T | 38.18 T | 33.23 T | 26.87 T | 10.61 M | 6.36 M | −0.71 M |
| Diversion scored gross (full opportunity cost of granted land and forgone tax) | 31.11 M | 21.21 M | 28.28 M | 26.87 T | 24.04 T | 10.61 M | 6.36 M | −0.71 M |
| Diversion excluded (counterfactual; only emitted flows scored) | 70.00 T | 46.67 T | 44.55 T | 36.06 T | 26.87 T | 10.61 M | 12.02 T | 2.12 M |
| National/global denominator (the strongest alternative a critic would choose) | 55.15 T | 38.18 T | 38.89 T | 33.23 T | 26.87 T | 21.92 M | 17.68 M | 7.78 M |
T = Transmuter, M = Magnifier; bold marks a change from the central construction.
The diversion treatment is the pivot, and it swings three placements across quadrants. Scored gross, UBC, SFU and BCIT all move from Transmuter to Magnifier, because the full opportunity cost of granted land and forgone tax outweighs the housing and payroll that place them above the line. Excluded as a counterfactual, AbCellera moves the other way, from Magnifier to Transmuter. The central construction sits between these two, and a reader who prefers either end should read the placements accordingly.
The denominator alternative flips no quadrant and changes one sign. Counting output that lands outside British Columbia raises every firm, because that is where most of their output goes: Ballard moves from −0.71 to +7.78, so its status as the only subject at negative net work holds only under the BC-resident denominator this note chose. The five education institutions barely move, because their measured output is already largely in-province.
The eight-level model raises the largest research producer most. Inserting a cognitive tier above esteem (modelled by raising the actualization weight from 1 to 3) adds +11.31 to UBC, +8.49 to SFU, +7.07 to AbCellera, +5.66 to BCIT, +4.24 to Ballard, +2.83 to NVIT and NEC, and nothing to Lululemon. No quadrant moves. A reader who holds that knowledge production deserves more than the lightest weight in the vector should read every research-intensive placement upward.
Power handicap. The operational trigger fires for the four public institutions and for Lululemon. Reported at ρ = 1 the five Transmuters hold, and the handicap needed to move each out of the Transmuter quadrant is small: ΔM = 0.189 for SFU, 0.566 for BCIT, 0.754 for UBC, 1.131 for Native Education College and 1.226 for NVIT, in per-level F/A units per standard period. A reviewer who holds that a landholding institution should be scored against a raised bar can move SFU and BCIT off the Transmuter placement with a handicap well under one scale point.
What the pre-publication gate found
Every stated assumption and the per-level table faced an adversarial challenger and a three-defender panel before publication. Ten register entries, fifty agents, no entry left unassessed. One entry survived unchallenged (the F and A scale). The rest produced standing alternative constructions, and nine of them move a placement. Each is recorded here because a placement that swings under a reasonable alternative is information the reader is owed.
| Alternative construction | What moves |
|---|---|
| Scope set at the consolidated reporting entity, pulling UBC Properties Trust and SFU Community Trust inside the evaluated unit and dropping the existing-asset cap on granted land converted to market product | UBC to W = 47.38 (Fagg −1.33) and SFU to W = 33.94 (Fagg −2.00), both Transmuter to Magnifier. The headline becomes three Transmuters and five Magnifiers |
| Diversion uncapped for actively converted granted land (UBC physiological F +4 to 0, SFU +2 to 0) | UBC to W = 40.31 and SFU to W = 30.41, both to Magnifier; BCIT holds Transmuter by 0.80 on the same cell |
| Point Grey leasehold portion scored gross at physiological (UBC F +4 to −1) | UBC to W = 36.77, Fagg −11.33, Magnifier, and third on the roster behind BCIT and SFU |
| Uniform power handicap at ΔM = 0.8 | UBC, SFU and BCIT all read Magnifier; only NVIT and NEC hold Transmuter. At ΔM = 1.8 all five schools read Magnifier and all three firms Extractor |
| Per-subject handicap vector (UBC 2.0, SFU and BCIT 1.0, AbCellera 0.75, Lululemon 0.5, the rest 0 under the voluntariness guard) | Two Transmuters and six Magnifiers. NVIT and NEC take the top two W ranks and displace UBC, so this note's title claim does not survive this construction |
| Ballard's safety row on in-window flows only (F −3 to −1) | Ballard rises to W = +4.95. The "only negative" finding and the τ = 0.917 sign flip both disappear. The negative survives only at F ≤ −3, since it crosses zero at F = −2.75 |
| Actualization weight above 1.33 (any cognitive-tier model) | Ballard's W crosses zero, so the "one negative" headline holds only while knowledge production is weighted at or near the bottom of the vector |
| Exemption priced from the note's own ratios and booked live at safety | SFU to Magnifier; UBC's Fagg lands exactly on 0.00, archetype undetermined |
| Belonging rebuilt with Indigenous governance re-booked to safety | No quadrant moves, but NEC overtakes SFU and the absolute ordering stops tracking institutional size |
Three findings about the intensity column that qualify it further. Running the τ band across the per-dollar figures reorders them six times inside [0.8, 1.5] against zero reorderings in the absolute table, so most of that column is τ-unstable; the one result that holds is the inversion by size (NEC above NVIT above BCIT above SFU above UBC), whose nearest crossing sits at τ = 325.8. The NEC-over-UBC multiple this note prints as 160 runs from 153 to 176 across the same band. And restating the denominator as public transfer per credential awarded puts NEC third of five at 1.8 times UBC rather than first at 160 times, which is the single largest qualification the gate placed on this note's most quotable number.
One finding qualifies the verdict card. Restating F on the absolute basis the central construction uses elsewhere (NEC safety +3 to +1, NVIT +2 to +1) leaves both as Transmuters but drops NEC to fourth on filtering, behind NVIT, UBC and BCIT, which retires the claim that the two Indigenous-serving institutions carry the roster's two highest filtering scores.
The full challenge matrix, including the two constructions the defender panels killed and the minority dissents recorded against four of the standing ones, is in the assumption-challenge ledger published with this note.
Rows dropped, and why
- Dollar value of the property-tax exemption. Not scored; the withholding is published as a finding.
- Housing units built on institutional land. Not closeable for any subject. Student housing beds are scored instead and rest on one publisher, one basis and one date.
- Prestige and recognition (esteem, w=2). No instrument ranks universities and firms on one scale.
- Research output. The disclosure asymmetry reverses on this row, with AbCellera and Ballard publishing patent counts that SFU and UBC do not. Research spend is scored instead.
The audit protocol (six inputs)
An audited placement requires six inputs. The Foundation offers framework, scoring template, methodological support, and the published report to any party willing to supply them.
- Audited payroll and headcount at British Columbia sites, on a full-time-equivalent basis.
- Land held on current title, with the assessed value and the exemption status of each folio.
- Cash public transfers received in the window, with committed-but-undrawn amounts stated separately.
- Student housing beds and completed housing units, with the below-market share separated.
- Graduate outcomes at institution level, including debt at graduation counted across all graduates rather than borrowers only.
- Any consent or relationship instrument with a host Nation, with its binding character and term stated.
Contact: sev@economyofwisdom.com.
The math is at transmutarianism.org/framework/. Working artifacts for this note, including the source register, the assumption-challenge ledger and the derivation script, are published in the repository. To dispute a placement, substitute different F and A values per level, with a source for each, and the dot moves.